## Multi-Panel Graph: Cross-Entropy, Path-Entropy, and Rationality Metrics
### Overview
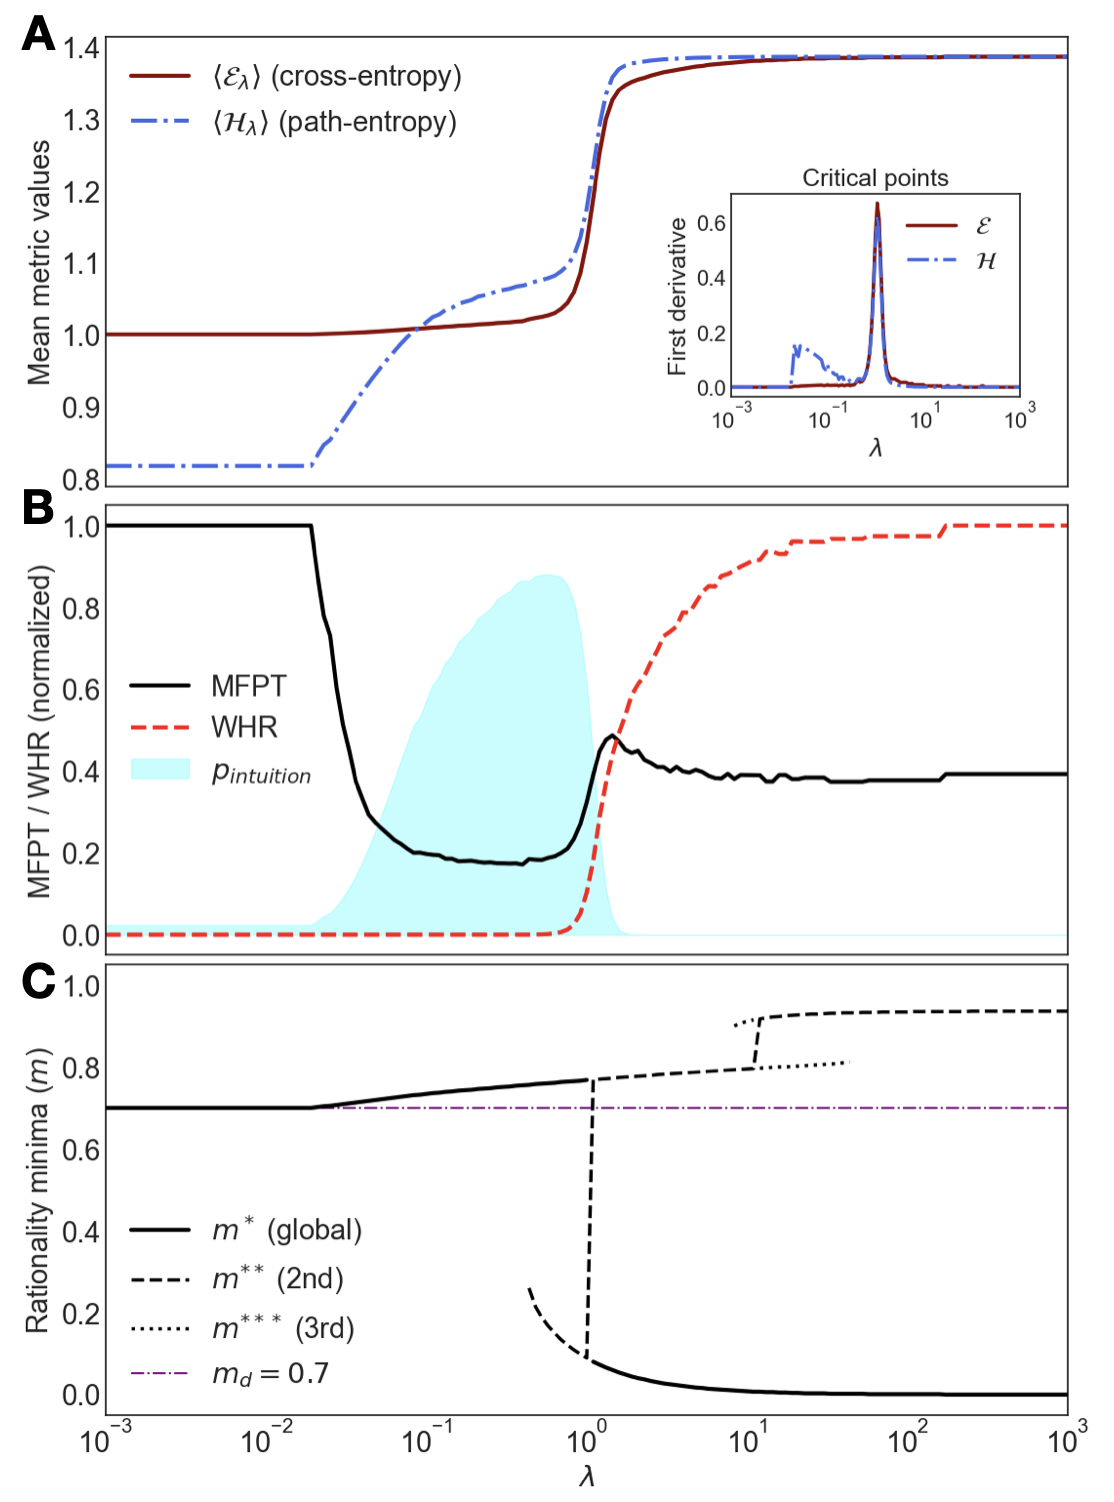
The image contains three vertically stacked panels (A, B, C) analyzing metrics across a logarithmic λ-axis (10⁻³ to 10³). Panel A compares cross-entropy (⟨Eλ⟩) and path-entropy (⟨Hλ⟩), Panel B contrasts MFPT/WHR ratios with an intuition region, and Panel C examines rationality minima under different criteria.
---
### Components/Axes
**Panel A**
- **Y-axis**: Mean metric values (0.8–1.4)
- **X-axis**: λ (log scale: 10⁻³ to 10³)
- **Lines**:
- Solid red: ⟨Eλ⟩ (cross-entropy)
- Dashed blue: ⟨Hλ⟩ (path-entropy)
- **Inset**: First derivative of E and H (peaks at λ ≈ ±1)
**Panel B**
- **Y-axis**: MFPT/WHR (normalized, 0–1.0)
- **X-axis**: λ (log scale: 10⁻³ to 10³)
- **Lines**:
- Solid black: MFPT
- Dashed red: WHR
- **Shaded region**: p_intuition (light blue, λ ≈ 10⁻¹ to 10⁰)
**Panel C**
- **Y-axis**: Rationality minima (m, 0–1.0)
- **X-axis**: λ (log scale: 10⁻³ to 10³)
- **Lines**:
- Solid black: m* (global)
- Dashed black: m** (2nd order)
- Dotted black: m*** (3rd order)
- Dash-dot purple: m_d = 0.7
---
### Detailed Analysis
**Panel A**
- ⟨Eλ⟩ (red) starts at ~1.0, rises sharply at λ ≈ 10⁻¹, plateaus near 1.3.
- ⟨Hλ⟩ (blue) begins at ~0.8, increases gradually, overtakes ⟨Eλ⟩ at λ ≈ 10⁻¹, and plateaus at ~1.3.
- **Inset**: First derivative of E (red) peaks sharply at λ ≈ 1, while H (blue) has a broader peak centered at λ ≈ 1.
**Panel B**
- MFPT (black) starts at 1.0, drops to ~0.2 at λ ≈ 10⁻¹, then rises to ~0.8.
- WHR (red) begins near 0, rises steeply at λ ≈ 10⁻¹, plateaus at ~0.8.
- **p_intuition** (light blue) spans λ ≈ 10⁻¹ to 10⁰, overlapping with MFPT/WHR transition.
**Panel C**
- **m* (global)**: Starts at ~0.8, drops to ~0.4 at λ ≈ 10⁻¹, then plateaus.
- **m** (2nd order): Sharp drop at λ ≈ 10⁻¹, then gradual decline.
- **m*** (3rd order): Steeper drop at λ ≈ 10⁻¹, followed by oscillations.
- **m_d = 0.7** (purple): Horizontal line at y = 0.7, intersecting m* at λ ≈ 10⁰.
---
### Key Observations
1. **Panel A**: ⟨Hλ⟩ surpasses ⟨Eλ⟩ at λ ≈ 10⁻¹, suggesting path-entropy dominates in this regime.
2. **Panel B**: The intuition region (p_intuition) aligns with the MFPT/WHR crossover, implying heuristic relevance.
3. **Panel C**: All rationality metrics (m*) converge toward m_d = 0.7 at λ ≈ 10⁰, indicating a critical threshold.
---
### Interpretation
- **Panel A**: The divergence between cross-entropy and path-entropy highlights trade-offs in optimization landscapes. The inset’s derivative peaks suggest λ ≈ 1 is a critical point for sensitivity.
- **Panel B**: The intuition region (p_intuition) may represent a "sweet spot" where MFPT and WHR align, potentially guiding heuristic decision-making.
- **Panel C**: The convergence of rationality metrics at m_d = 0.7 implies this value acts as a universal benchmark across criteria. The 2nd/3rd-order minima (m**, m***) show increased sensitivity to λ near 10⁻¹, possibly reflecting higher-order corrections.
**Critical Insight**: The graphs collectively suggest λ ≈ 10⁻¹ to 10⁰ is a pivotal range for balancing entropy metrics, intuition, and rationality, with m_d = 0.7 serving as a normative threshold.