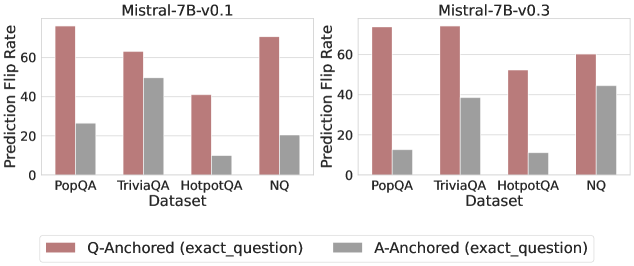
## Bar Chart: Prediction Flip Rate Comparison for Mistral-7B Models (v0.1 and v0.3)
### Overview
The image compares prediction flip rates for two versions of the Mistral-7B language model (v0.1 and v0.3) across four datasets (PopQA, TriviaQA, HotpotQA, NQ). Two anchoring strategies are evaluated: **Q-Anchored (exact_question)** and **A-Anchored (exact_question)**, represented by red and gray bars respectively. The y-axis measures prediction flip rate as a percentage.
### Components/Axes
- **X-Axis (Datasets)**: PopQA, TriviaQA, HotpotQA, NQ (left to right).
- **Y-Axis (Prediction Flip Rate)**: 0% to 80% in 20% increments.
- **Legend**:
- Red = Q-Anchored (exact_question)
- Gray = A-Anchored (exact_question)
- **Model Versions**:
- Left subplot = Mistral-7B-v0.1
- Right subplot = Mistral-7B-v0.3
### Detailed Analysis
#### Mistral-7B-v0.1
- **PopQA**:
- Q-Anchored: ~70% (red)
- A-Anchored: ~25% (gray)
- **TriviaQA**:
- Q-Anchored: ~60% (red)
- A-Anchored: ~50% (gray)
- **HotpotQA**:
- Q-Anchored: ~40% (red)
- A-Anchored: ~10% (gray)
- **NQ**:
- Q-Anchored: ~70% (red)
- A-Anchored: ~20% (gray)
#### Mistral-7B-v0.3
- **PopQA**:
- Q-Anchored: ~70% (red)
- A-Anchored: ~15% (gray)
- **TriviaQA**:
- Q-Anchored: ~70% (red)
- A-Anchored: ~40% (gray)
- **HotpotQA**:
- Q-Anchored: ~50% (red)
- A-Anchored: ~10% (gray)
- **NQ**:
- Q-Anchored: ~60% (red)
- A-Anchored: ~45% (gray)
### Key Observations
1. **Q-Anchored Dominance**: Across all datasets and models, Q-Anchored consistently outperforms A-Anchored, with flip rates 2–4× higher in most cases.
2. **Version-Specific Trends**:
- **v0.1**: Largest gap between anchoring strategies in HotpotQA (40% vs. 10%).
- **v0.3**: Narrowed gap in TriviaQA (70% vs. 40%) and NQ (60% vs. 45%), suggesting improved A-Anchored performance.
3. **Dataset Variability**:
- PopQA and TriviaQA show the highest flip rates for Q-Anchored in both versions.
- NQ exhibits the most significant A-Anchored improvement in v0.3 (+25% vs. v0.1).
### Interpretation
The data suggests that **Q-Anchored (exact_question)** anchoring improves model confidence, as evidenced by higher prediction flip rates. However, **Mistral-7B-v0.3** shows notable progress in A-Anchored performance, particularly for natural questions (NQ), where the gap between anchoring strategies reduced by ~20%. This may indicate architectural or training improvements in v0.3 that better align with real-world question structures. The persistent dominance of Q-Anchored highlights the importance of question specificity in model reliability, while the narrowing gaps in v0.3 suggest potential for more robust generalization in future iterations.