\n
## Bar Chart: Prediction Flip Rate for Mistral Models
### Overview
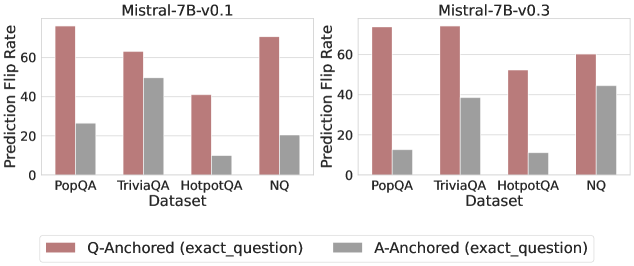
This image presents a comparative bar chart illustrating the prediction flip rate for two versions of the Mistral-7B language model (v0.1 and v0.3) across four different datasets: PopQA, TriviaQA, HotpotQA, and NQ. The flip rate is measured as a percentage and is shown for both "Q-Anchored" (exact question) and "A-Anchored" (exact question) scenarios.
### Components/Axes
* **X-axis:** Dataset - PopQA, TriviaQA, HotpotQA, NQ.
* **Y-axis:** Prediction Flip Rate - Scale ranges from 0 to 60 (approximately).
* **Models:** Mistral-7B-v0.1 (left chart), Mistral-7B-v0.3 (right chart).
* **Legend:**
* Red: Q-Anchored (exact\_question)
* Gray: A-Anchored (exact\_question)
### Detailed Analysis
**Mistral-7B-v0.1 (Left Chart)**
* **PopQA:** Q-Anchored flip rate is approximately 62%. A-Anchored flip rate is approximately 24%.
* **TriviaQA:** Q-Anchored flip rate is approximately 68%. A-Anchored flip rate is approximately 46%.
* **HotpotQA:** Q-Anchored flip rate is approximately 44%. A-Anchored flip rate is approximately 8%.
* **NQ:** Q-Anchored flip rate is approximately 66%. A-Anchored flip rate is approximately 42%.
**Mistral-7B-v0.3 (Right Chart)**
* **PopQA:** Q-Anchored flip rate is approximately 64%. A-Anchored flip rate is approximately 12%.
* **TriviaQA:** Q-Anchored flip rate is approximately 70%. A-Anchored flip rate is approximately 48%.
* **HotpotQA:** Q-Anchored flip rate is approximately 48%. A-Anchored flip rate is approximately 10%.
* **NQ:** Q-Anchored flip rate is approximately 68%. A-Anchored flip rate is approximately 44%.
**Trends:**
* For both models, the Q-Anchored flip rate is consistently higher than the A-Anchored flip rate across all datasets.
* The Q-Anchored flip rate is generally high (above 60%) for all datasets in both models.
* The A-Anchored flip rate varies more significantly across datasets.
### Key Observations
* The largest difference between Q-Anchored and A-Anchored flip rates is observed in the PopQA dataset for both models.
* The HotpotQA dataset consistently shows the lowest A-Anchored flip rate for both models.
* The Mistral-7B-v0.3 model generally exhibits a slightly lower A-Anchored flip rate compared to the v0.1 model, except for the NQ dataset.
### Interpretation
The data suggests that the Mistral models are more sensitive to changes in the question phrasing (Q-Anchored) than changes in the answer phrasing (A-Anchored). This indicates that the models rely more heavily on the question context when making predictions. The higher flip rates for Q-Anchored scenarios suggest that even small alterations to the question can lead to different predictions.
The variation in flip rates across datasets likely reflects the inherent difficulty and characteristics of each dataset. For example, the low A-Anchored flip rate for HotpotQA might indicate that the answers in this dataset are more robust to slight variations in phrasing.
The slight improvement in the v0.3 model (lower A-Anchored flip rates in most cases) suggests that the model updates have made it slightly less sensitive to changes in the answer phrasing, potentially indicating improved robustness. However, the differences are relatively small, and further analysis would be needed to confirm this trend. The consistent high Q-Anchored flip rate across both versions suggests that the core sensitivity to question phrasing remains.