## Line Graphs: PCA Eigenvalue Spectra in Bilinear Form Space (128M)
### Overview
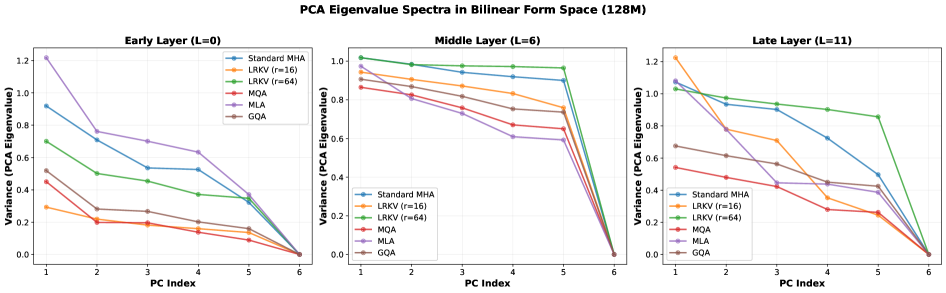
The image contains three line graphs comparing PCA eigenvalue spectra across three transformer layers (Early Layer L=0, Middle Layer L=6, Late Layer L=11). Each graph shows variance values (0-1.2) across principal component (PC) indices (1-6) for six methods: Standard MHA, LRKV (r=16), LRKV (r=64), MQA, MLA, and GQA. Lines are color-coded per legend.
### Components/Axes
- **X-axis**: PC Index (1-6), labeled "PC Index"
- **Y-axis**: Variance (PCA Eigenvalue), labeled "Variance (PCA Eigenvalue)"
- **Legends**:
- Standard MHA (blue)
- LRKV (r=16) (orange)
- LRKV (r=64) (green)
- MQA (red)
- MLA (purple)
- GQA (brown)
- **Graph Titles**:
- Early Layer (L=0)
- Middle Layer (L=6)
- Late Layer (L=11)
### Detailed Analysis
#### Early Layer (L=0)
- **Standard MHA**: Starts at ~0.9 (PC1), declines sharply to ~0.3 (PC6)
- **LRKV (r=16)**: Starts at ~0.3, declines to ~0.1
- **LRKV (r=64)**: Starts at ~0.7, declines to ~0.4
- **MQA**: Starts at ~0.4, declines to ~0.1
- **MLA**: Starts at ~1.2, declines to ~0.4
- **GQA**: Starts at ~0.5, declines to ~0.1
#### Middle Layer (L=6)
- **Standard MHA**: Starts at ~0.9, declines to ~0.6
- **LRKV (r=16)**: Starts at ~0.9, declines to ~0.7
- **LRKV (r=64)**: Starts at ~1.0, declines to ~0.9
- **MQA**: Starts at ~0.9, declines to ~0.7
- **MLA**: Starts at ~0.9, declines to ~0.6
- **GQA**: Starts at ~0.9, declines to ~0.7
#### Late Layer (L=11)
- **Standard MHA**: Starts at ~0.8, declines to ~0.4
- **LRKV (r=16)**: Starts at ~1.2, declines to ~0.3
- **LRKV (r=64)**: Starts at ~1.0, declines to ~0.8
- **MQA**: Starts at ~0.5, declines to ~0.2
- **MLA**: Starts at ~0.8, declines to ~0.4
- **GQA**: Starts at ~0.7, declines to ~0.4
### Key Observations
1. **Variance Reduction**: All methods show decreasing variance with higher PC indices, indicating diminishing returns in eigenvalue capture.
2. **Layer-Specific Patterns**:
- Early Layer (L=0): MLA shows highest initial variance (~1.2), while LRKV (r=16) has lowest (~0.3).
- Middle Layer (L=6): LRKV (r=64) maintains highest variance (~1.0), while MLA drops to ~0.6.
- Late Layer (L=11): LRKV (r=16) exhibits sharpest decline (~1.2→0.3), while MQA shows most gradual drop (~0.5→0.2).
3. **Method Performance**:
- LRKV (r=64) consistently retains higher variance across layers compared to other methods.
- MLA demonstrates strong early-layer performance but declines significantly in later layers.
- GQA shows relatively stable variance across layers (~0.5→0.4 in Late Layer).
### Interpretation
The data suggests that PCA eigenvalue spectra vary significantly across transformer layers and methods. Early layers (L=0) exhibit higher variance overall, with MLA capturing the most initial variance. As layers progress (L=6→L=11), variance generally decreases, but LRKV (r=64) maintains higher values, indicating better preservation of information. The sharp decline in LRKV (r=16) in Late Layer (L=11) suggests it may prioritize early principal components more aggressively. These patterns imply trade-offs between methods in balancing early vs. late-layer feature representation, with LRKV (r=64) showing the most consistent performance across layers.