## Image: Test Input/Output Grid
### Overview
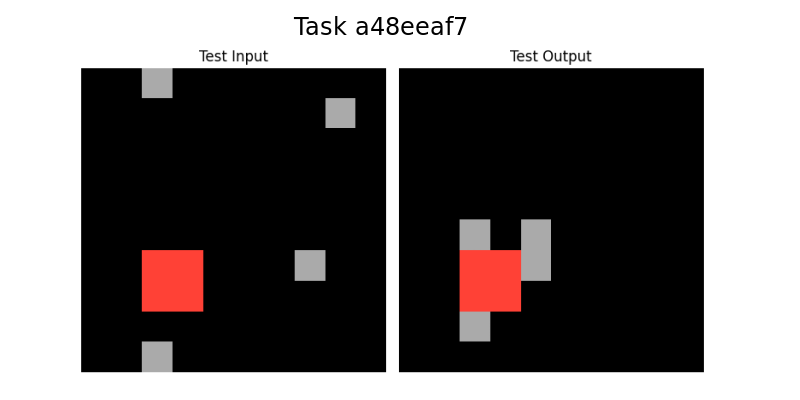
The image shows two grids side-by-side, labeled "Test Input" and "Test Output". Each grid is primarily black, with a few gray squares and one red square. The "Test Input" grid has the red square in the lower-left quadrant, while the "Test Output" grid has the red square in a similar position but surrounded by gray squares. The image is titled "Task a48eeaf7".
### Components/Axes
* **Title:** Task a48eeaf7 (centered at the top)
* **Left Grid:** Labeled "Test Input" (top-left of the grid)
* **Right Grid:** Labeled "Test Output" (top-right of the grid)
* **Grid Colors:** Black (background), Gray, Red
### Detailed Analysis or ### Content Details
**Test Input Grid:**
* Background: Black
* Red Square: Located in the lower-left quadrant. It's a single square.
* Gray Squares: There are four gray squares.
* One in the top-left quadrant.
* One in the top-right quadrant.
* One in the lower-left quadrant, below the red square.
* One in the lower-right quadrant.
**Test Output Grid:**
* Background: Black
* Red Square: Located in the lower-left quadrant, in the same relative position as in the "Test Input" grid.
* Gray Squares: There are three gray squares surrounding the red square.
* One above the red square.
* One to the left of the red square.
* One to the right of the red square.
### Key Observations
* The red square's position is consistent between the "Test Input" and "Test Output" grids.
* The "Test Output" grid shows the red square surrounded by gray squares, while the "Test Input" grid has scattered gray squares.
* The task appears to involve transforming the "Test Input" grid into the "Test Output" grid, specifically by adding gray squares around the red square.
### Interpretation
The image likely represents a visual reasoning task where the goal is to infer a rule or pattern that transforms the "Test Input" into the "Test Output". In this case, the rule seems to be to surround the red square with gray squares. This suggests a spatial reasoning or pattern recognition problem. The task ID "a48eeaf7" likely refers to a specific instance of this type of problem.