## Box Plot: Average Number of Neighbors vs. Step Number for Different Model Variants
### Overview
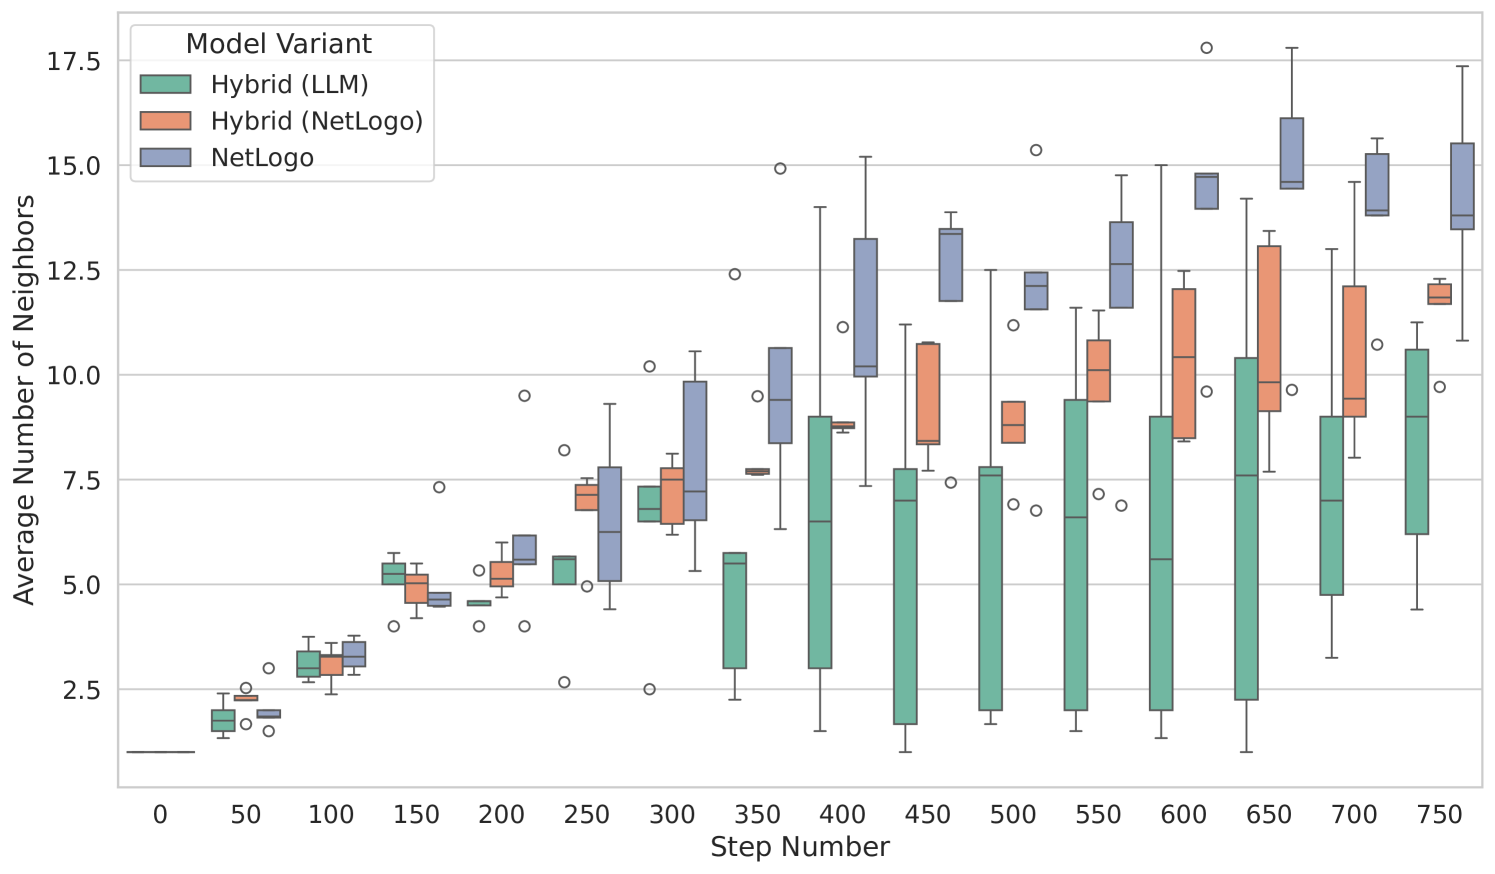
The image is a box plot comparing the average number of neighbors for three different model variants (Hybrid (LLM), Hybrid (NetLogo), and NetLogo) across various step numbers. The x-axis represents the step number, and the y-axis represents the average number of neighbors. The plot displays the distribution of the average number of neighbors for each model variant at each step number using box plots.
### Components/Axes
* **Title:** None explicitly given in the image.
* **X-axis:**
* Label: "Step Number"
* Scale: 0 to 750, with markers at 0, 50, 100, 150, 200, 250, 300, 350, 400, 450, 500, 550, 600, 650, 700, and 750.
* **Y-axis:**
* Label: "Average Number of Neighbors"
* Scale: 2.5 to 17.5, with markers at 2.5, 5.0, 7.5, 10.0, 12.5, 15.0, and 17.5.
* **Legend:** Located in the top-left corner.
* Hybrid (LLM): Teal color
* Hybrid (NetLogo): Salmon color
* NetLogo: Slate Blue color
### Detailed Analysis
The data is presented as box plots, where each box represents the interquartile range (IQR), the line inside the box represents the median, the whiskers extend to 1.5 times the IQR, and the circles represent outliers.
**Hybrid (LLM) - Teal:**
* Trend: Generally increasing from step 0 to step 350, then appears to plateau with some fluctuations.
* Step 0: Median around 1
* Step 50: Median around 2
* Step 100: Median around 3
* Step 150: Median around 4.5
* Step 200: Median around 5
* Step 250: Median around 6
* Step 300: Median around 7
* Step 350: Median around 5.5
* Step 400: Median around 2.5
* Step 450: Median around 7
* Step 500: Median around 7
* Step 550: Median around 9
* Step 600: Median around 9
* Step 650: Median around 9
* Step 700: Median around 9
* Step 750: Median around 9
**Hybrid (NetLogo) - Salmon:**
* Trend: Generally increasing from step 50 to step 750.
* Step 50: Median around 2.5
* Step 100: Median around 3.5
* Step 150: Median around 5
* Step 200: Median around 5.5
* Step 250: Median around 7
* Step 300: Median around 7
* Step 350: Median around 8
* Step 400: Median around 10
* Step 450: Median around 9
* Step 500: Median around 8
* Step 550: Median around 10
* Step 600: Median around 12
* Step 650: Median around 12
* Step 700: Median around 11
* Step 750: Median around 12
**NetLogo - Slate Blue:**
* Trend: Generally increasing from step 50 to step 750.
* Step 50: Median around 2
* Step 100: Median around 2
* Step 150: Median around 3.5
* Step 200: Median around 5
* Step 250: Median around 7
* Step 300: Median around 8
* Step 350: Median around 9
* Step 400: Median around 12
* Step 450: Median around 12
* Step 500: Median around 11
* Step 550: Median around 12
* Step 600: Median around 14
* Step 650: Median around 15
* Step 700: Median around 15
* Step 750: Median around 15
### Key Observations
* The Hybrid (LLM) model shows an initial increase in the average number of neighbors, but plateaus after step 350.
* The Hybrid (NetLogo) and NetLogo models show a consistent increase in the average number of neighbors as the step number increases.
* The NetLogo model generally has a higher average number of neighbors compared to the other two models, especially at later steps.
* There are several outliers in all three models, indicating some variability in the average number of neighbors.
### Interpretation
The box plot suggests that the NetLogo model and the Hybrid (NetLogo) model tend to form more connections (neighbors) as the simulation progresses, while the Hybrid (LLM) model's connectivity plateaus. This could indicate that the NetLogo and Hybrid (NetLogo) models are more effective at establishing and maintaining connections within the simulation environment as the number of steps increases. The Hybrid (LLM) model might have a different mechanism that limits the number of neighbors it forms after a certain point. The outliers suggest that there are instances where the average number of neighbors deviates significantly from the typical range for each model at each step. This could be due to random variations in the simulation or specific conditions that cause some agents to have significantly more or fewer neighbors than usual.