## Box Plot: Average Number of Neighbors by Model Variant and Step Number
### Overview
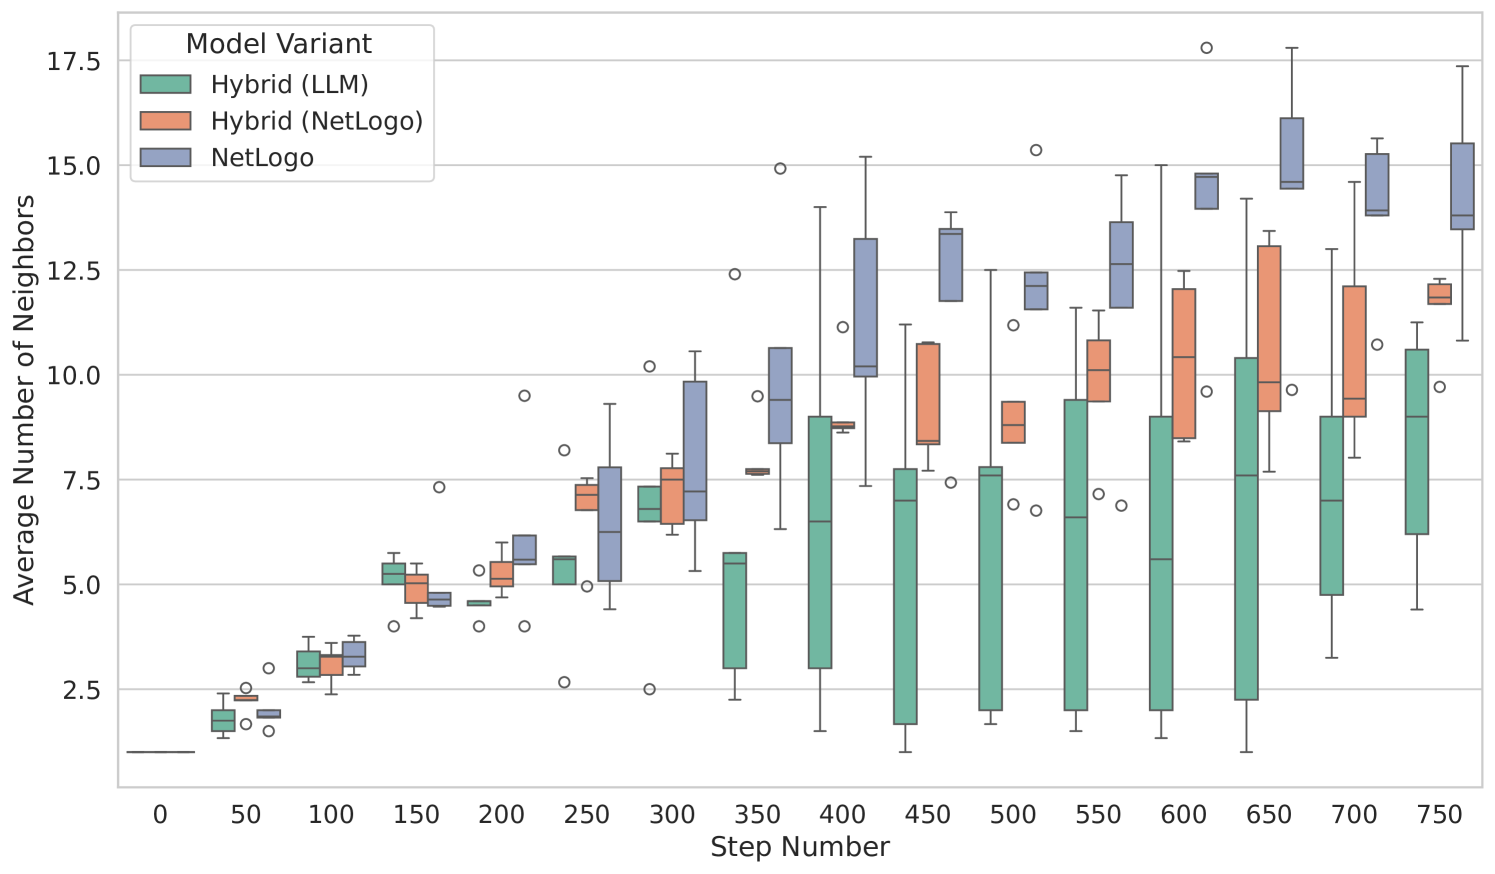
The image displays a comparative box plot analysis of three model variants (Hybrid LLM, Hybrid NetLogo, and NetLogo) across incremental step numbers (0–750). The y-axis represents the average number of neighbors, while the x-axis tracks step progression. Each model variant is represented by distinct colors: green (Hybrid LLM), orange (Hybrid NetLogo), and blue (NetLogo). Outliers are marked as individual dots beyond the whiskers.
### Components/Axes
- **Title**: "Model Variant" (legend header)
- **X-axis**: "Step Number" (0–750, linear scale)
- **Y-axis**: "Average Number of Neighbors" (0–17.5, linear scale)
- **Legend**: Top-left corner, mapping colors to model variants:
- Green: Hybrid (LLM)
- Orange: Hybrid (NetLogo)
- Blue: NetLogo
- **Box Plot Elements**:
- Median line (bold horizontal line within each box)
- Interquartile range (IQR, box height)
- Whiskers (extending to 1.5×IQR)
- Outliers (dots beyond whiskers)
### Detailed Analysis
1. **Step 0–100**:
- All models show low median values (1–3 neighbors).
- Hybrid LLM (green) has the lowest median (~2), while NetLogo (blue) has the highest (~3).
- Minimal variability (narrow boxes and few outliers).
2. **Step 100–300**:
- Gradual increase in medians:
- Hybrid LLM: ~4–6
- Hybrid NetLogo: ~5–7
- NetLogo: ~6–8
- Box plots widen, indicating increased variability.
- Outliers begin appearing (~7–10 neighbors).
3. **Step 300–500**:
- Medians rise sharply:
- Hybrid LLM: ~8–10
- Hybrid NetLogo: ~9–11
- NetLogo: ~11–13
- Outliers extend to ~14–16 neighbors.
- Hybrid LLM surpasses Hybrid NetLogo in median values.
4. **Step 500–750**:
- Medians plateau but remain elevated:
- Hybrid LLM: ~10–12
- Hybrid NetLogo: ~12–14
- NetLogo: ~14–16
- Box plots are widest, showing high variability.
- Outliers reach up to ~18 neighbors (NetLogo).
### Key Observations
- **Trend**: All models exhibit increasing medians with step progression, with NetLogo consistently outperforming others.
- **Outliers**: More frequent in later steps, suggesting rare but extreme outcomes.
- **Variability**: Widening boxes at higher steps indicate greater divergence in neighbor counts.
- **Color Consistency**: Legend colors match box plot hues (green/orange/blue) without discrepancies.
### Interpretation
The data demonstrates that **NetLogo** maintains the highest average neighbor count across all steps, while **Hybrid LLM** shows the most significant improvement over time, overtaking Hybrid NetLogo by step 500. The increasing variability in later steps suggests that model performance becomes less predictable as steps progress. Outliers in advanced steps may indicate edge cases or anomalies in neighbor distribution. This trend could reflect differences in model architecture, optimization strategies, or sensitivity to incremental changes in input data.