\n
## Line Chart: Accuracy vs. Number of Thoughts per Step
### Overview
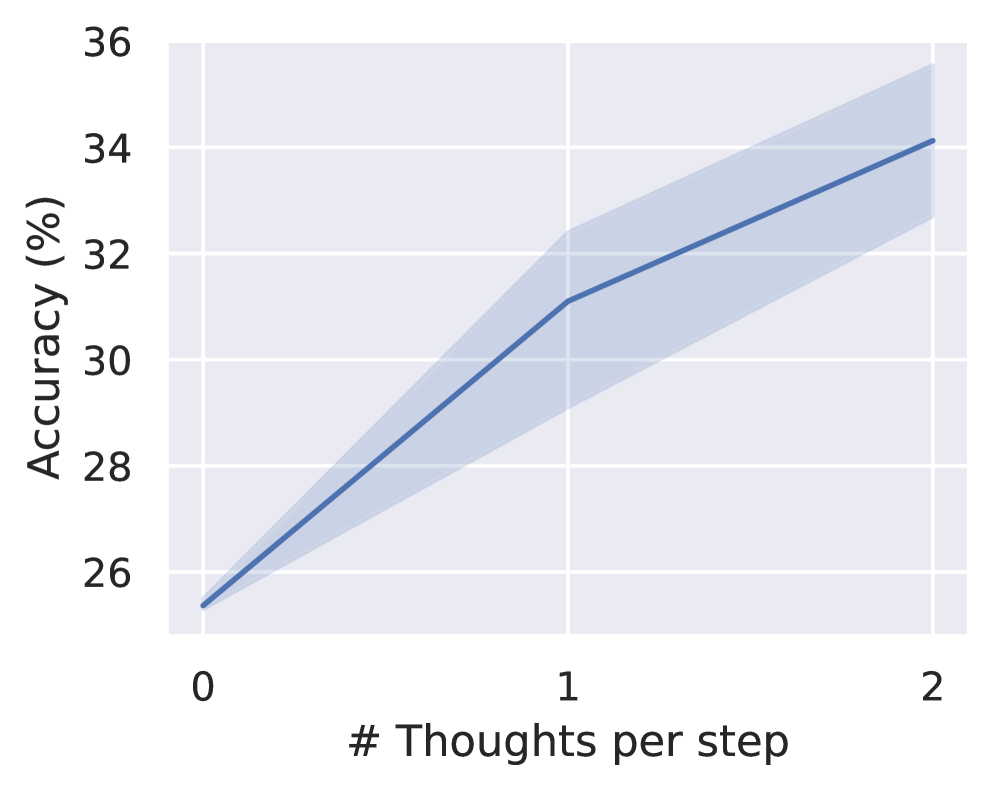
This image presents a line chart illustrating the relationship between the number of "Thoughts per step" and "Accuracy (%)". The chart displays a single data series with a shaded region representing the confidence interval or variance around the central trend.
### Components/Axes
* **X-axis:** Labeled "# Thoughts per step". The scale ranges from 0 to 2, with markers at 0, 1, and 2.
* **Y-axis:** Labeled "Accuracy (%)". The scale ranges from 26 to 36, with markers at 26, 28, 30, 32, 34, and 36.
* **Data Series:** A single blue line representing the trend of accuracy as a function of thoughts per step.
* **Shaded Region:** A light blue area surrounding the line, indicating the uncertainty or variance in the data.
### Detailed Analysis
The blue line exhibits an upward trend, indicating that as the number of thoughts per step increases, the accuracy also increases.
* **At 0 Thoughts per step:** The accuracy is approximately 26%.
* **At 1 Thought per step:** The accuracy increases to approximately 30.5%.
* **At 2 Thoughts per step:** The accuracy reaches approximately 34%.
The shaded region indicates the following approximate bounds:
* **At 0 Thoughts per step:** The lower bound of the shaded region is approximately 25.5%, and the upper bound is approximately 27.5%.
* **At 1 Thought per step:** The lower bound of the shaded region is approximately 28.5%, and the upper bound is approximately 32.5%.
* **At 2 Thoughts per step:** The lower bound of the shaded region is approximately 32%, and the upper bound is approximately 36%.
### Key Observations
The chart demonstrates a positive correlation between the number of thoughts per step and accuracy. The confidence interval (shaded region) widens as the number of thoughts per step increases, suggesting greater uncertainty in the accuracy estimates at higher thought counts.
### Interpretation
The data suggests that increasing the number of "thoughts per step" leads to improved accuracy. This could be interpreted in the context of a problem-solving process, where more deliberate consideration (more "thoughts") at each step results in more accurate outcomes. The widening confidence interval at higher thought counts might indicate diminishing returns or increased complexity as the number of thoughts increases, leading to greater variability in the results. The chart implies that there is a benefit to increasing the number of thoughts per step, at least up to the tested value of 2, but further investigation would be needed to determine if this trend continues indefinitely or if there is an optimal number of thoughts per step beyond which accuracy plateaus or declines.