# Technical Document Extraction: Line Chart Analysis
## Chart Overview
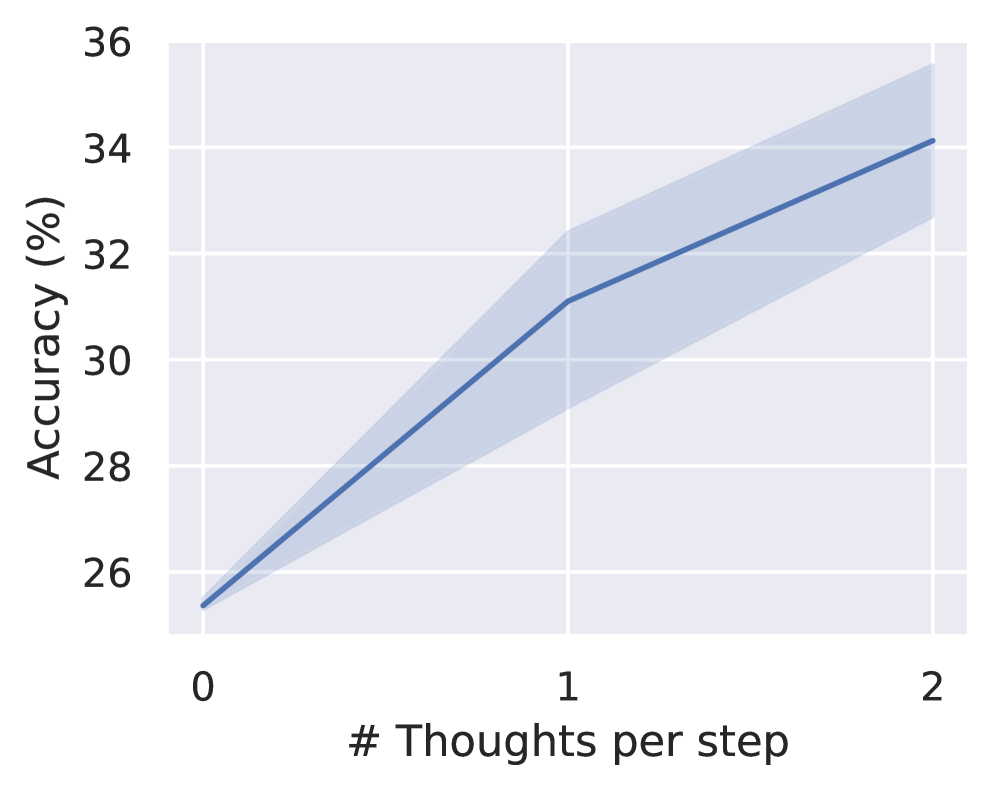
The image depicts a **line chart** with a shaded gradient area, representing the relationship between the number of thoughts per step and accuracy percentage. The chart uses a **blue line** with a **light-to-dark blue gradient shading** to indicate uncertainty or confidence intervals.
---
### Axis Labels and Markers
- **X-Axis**:
- Title: `# Thoughts per step`
- Values: `0`, `1`, `2` (discrete steps)
- **Y-Axis**:
- Title: `Accuracy (%)`
- Range: `25%` to `36%` (increments of `2%`)
---
### Data Points and Trend
1. **Line Data**:
- **Point 1**: `(0, 25.5%)`
- **Point 2**: `(1, 31.0%)`
- **Point 3**: `(2, 34.0%)`
- **Trend**: The line exhibits a **steady upward slope**, increasing by approximately `5.5%` per step.
2. **Shaded Area**:
- Represents a **confidence interval** or uncertainty range.
- Gradient transitions from **light blue** (near the line) to **dark blue** (at the edges), suggesting diminishing confidence with distance from the central trend.
---
### Legend and Annotations
- **Legend**:
- Located in the **top-right corner** of the chart.
- **No explicit label** is provided for the line or shaded area.
- **Color Reference**: The line and shading are both blue, but no textual legend entry is visible.
---
### Spatial Grounding and Component Isolation
- **Main Chart Region**:
- Dominates the center of the image.
- Shaded area spans the full width of the chart, anchored to the line.
- **Footer/Background**:
- No additional annotations or text outside the chart area.
---
### Key Observations
1. **Accuracy Correlation**:
- Accuracy improves linearly as the number of thoughts per step increases.
- From `25.5%` at `0` thoughts to `34.0%` at `2` thoughts.
2. **Uncertainty Representation**:
- The shaded gradient implies higher confidence near the central trend line and lower confidence at the extremes.
---
### Missing Elements
- **Legend Label**: No textual description of the line or shaded area is present.
- **Secondary Axes/Annotations**: None observed.
---
### Conclusion
The chart demonstrates a direct, positive correlation between the number of thoughts per step and accuracy. The shaded gradient provides a visual cue for uncertainty, though the absence of a legend label limits interpretability.