## Line Graphs: Contrast vs. Frequency Analysis
### Overview
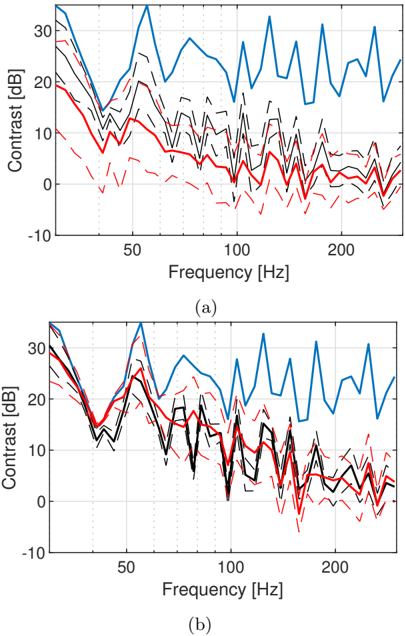
The image contains two line graphs (labeled a) and b)) depicting contrast measurements in decibels (dB) across a frequency range of 0–200 Hz. Each graph includes three data series represented by distinct line styles and colors: solid blue, dashed red, and dotted black. The graphs share identical axes but differ in data series behavior.
### Components/Axes
- **X-axis**: Frequency [Hz], scaled linearly from 0 to 200 Hz with gridlines at 50, 100, and 150 Hz.
- **Y-axis**: Contrast [dB], scaled linearly from -10 to 30 dB with gridlines at 0, 10, 20, and 30 dB.
- **Legends**: Located in the top-right corner of both graphs. Colors and line styles correspond as follows:
- **Solid blue**: Primary data series (highest contrast values).
- **Dashed red**: Secondary data series (intermediate contrast values).
- **Dotted black**: Tertiary data series (lowest contrast values).
### Detailed Analysis
#### Graph (a)
- **Solid blue line**: Peaks at ~100 Hz (~25 dB), dips to ~5 dB at 50 Hz, and rises again to ~20 dB at 200 Hz. Shows moderate amplitude modulation.
- **Dashed red line**: Peaks at ~150 Hz (~15 dB), dips to ~0 dB at 50 Hz, and fluctuates between 0–10 dB. Less stable than the blue line.
- **Dotted black line**: Peaks at ~75 Hz (~8 dB), dips to ~-5 dB at 100 Hz, and stabilizes near 0 dB at 200 Hz. Most erratic trend.
#### Graph (b)
- **Solid blue line**: Peaks at ~50 Hz (~30 dB) and ~150 Hz (~28 dB), with a trough of ~10 dB at 100 Hz. Highest amplitude modulation.
- **Dashed red line**: Sharp dip to ~-5 dB at 100 Hz, peaks at ~200 Hz (~10 dB). More volatile than in graph (a).
- **Dotted black line**: Deepest dip at 100 Hz (~-10 dB), peaks at ~25 Hz (~5 dB). Most unstable series.
### Key Observations
1. **Consistent Trends**: The solid blue line consistently exhibits the highest contrast values across both graphs, suggesting it represents a dominant or stable factor.
2. **Frequency-Specific Dips**: Both graphs show significant contrast reductions at 100 Hz (black line in a), 100 Hz (red line in b), and 50 Hz (red line in a).
3. **Amplitude Variability**: The dotted black line demonstrates the greatest instability, with sharp troughs and peaks, potentially indicating noise or transient effects.
4. **Graph Discrepancies**: Graph (b) shows more pronounced amplitude modulation (e.g., 30 dB peak in blue line) compared to graph (a), suggesting differing experimental conditions.
### Interpretation
The data likely represents acoustic or signal processing measurements, where contrast (e.g., signal-to-noise ratio) varies with frequency. The solid blue line’s consistent dominance implies a primary contributor (e.g., a stable sound source), while the dashed red and dotted black lines may represent secondary factors or noise. The recurring dips at 50–100 Hz suggest resonant frequencies or interference patterns. The increased volatility in graph (b) could indicate experimental perturbations (e.g., environmental noise, equipment calibration differences). The black line’s erratic behavior in both graphs warrants further investigation into measurement artifacts or transient events.