## Line Chart: Mean Up-Clipped Probability vs. Step
### Overview
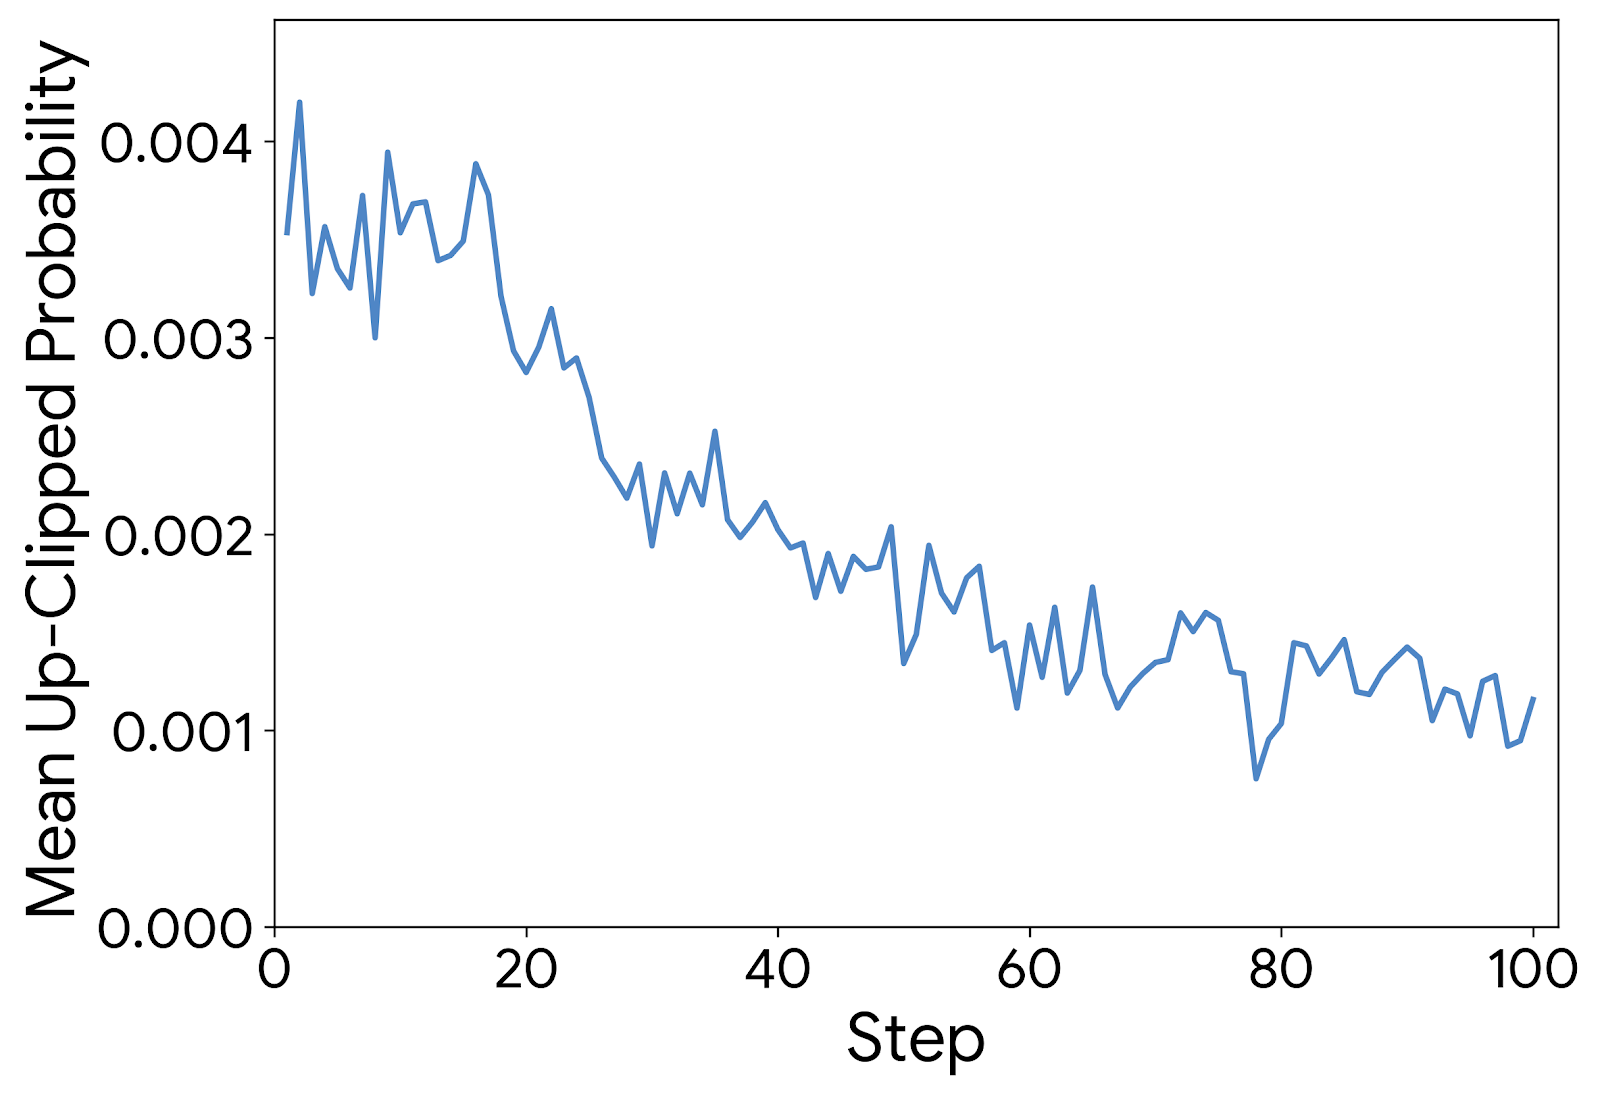
The image is a line chart showing the relationship between "Mean Up-Clipped Probability" (y-axis) and "Step" (x-axis). The blue line represents the data, which generally decreases as the step increases.
### Components/Axes
* **X-axis:** "Step" ranging from 0 to 100, with markers at 0, 20, 40, 60, 80, and 100.
* **Y-axis:** "Mean Up-Clipped Probability" ranging from 0.000 to 0.004, with markers at 0.000, 0.001, 0.002, 0.003, and 0.004.
* **Data Series:** A single blue line representing the "Mean Up-Clipped Probability" over the steps.
### Detailed Analysis
* **Trend:** The blue line shows a decreasing trend in the "Mean Up-Clipped Probability" as the "Step" increases. The decrease is more pronounced in the initial steps (0-40), and the line flattens out towards the end (60-100).
* **Data Points:**
* At Step 0, the Mean Up-Clipped Probability is approximately 0.0035.
* At Step 20, the Mean Up-Clipped Probability is approximately 0.003.
* At Step 40, the Mean Up-Clipped Probability is approximately 0.0022.
* At Step 60, the Mean Up-Clipped Probability is approximately 0.0017.
* At Step 80, the Mean Up-Clipped Probability is approximately 0.0012.
* At Step 100, the Mean Up-Clipped Probability is approximately 0.001.
### Key Observations
* The "Mean Up-Clipped Probability" starts high and decreases over the first 40 steps.
* The rate of decrease slows down after step 40, and the probability stabilizes between 0.001 and 0.0015.
* There are fluctuations in the line, indicating some variability in the probability at each step.
### Interpretation
The chart suggests that as the "Step" increases, the "Mean Up-Clipped Probability" decreases. This could indicate that the model or process being measured is converging or stabilizing over time. The initial rapid decrease might represent a learning or adjustment phase, while the later stabilization suggests that the system has reached a more steady state. The fluctuations in the line could be due to noise or inherent variability in the process.