\n
## Line Chart: Mean Up-Clipped Probability vs. Step
### Overview
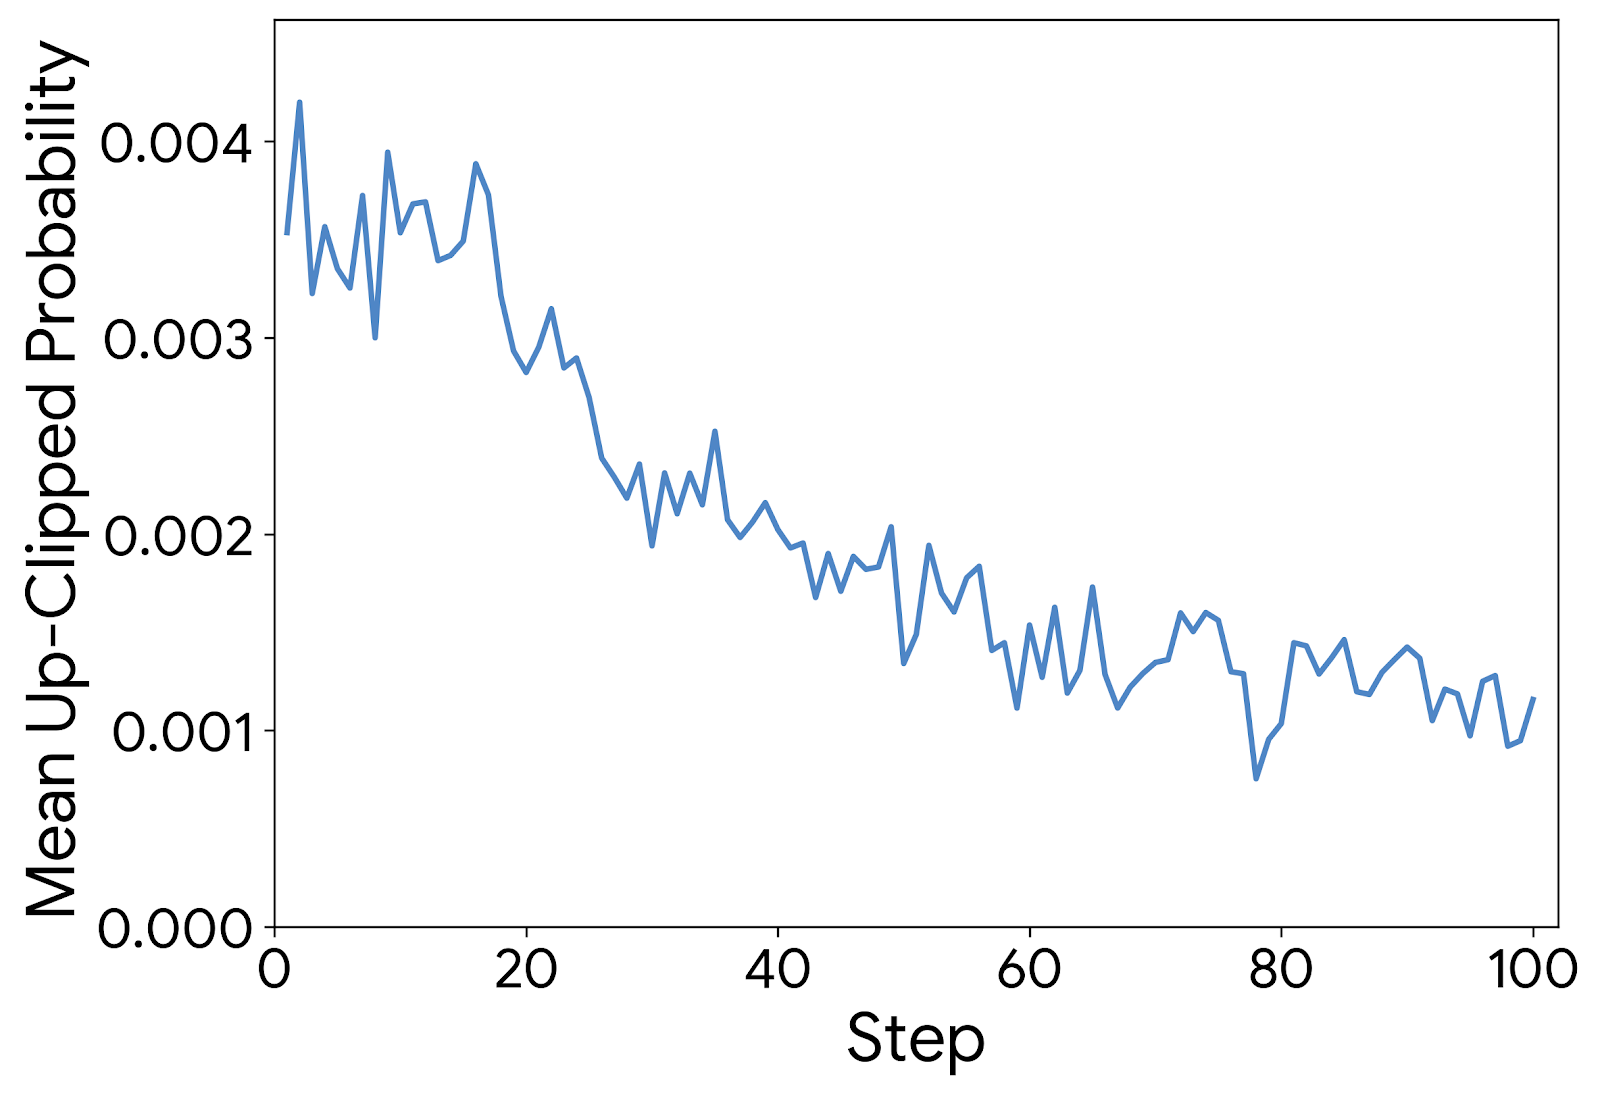
The image presents a line chart illustrating the relationship between "Step" and "Mean Up-Clipped Probability". The chart displays a single data series showing a decreasing trend in probability as the step number increases, with some fluctuations.
### Components/Axes
* **X-axis:** Labeled "Step", ranging from 0 to 100. The axis is linearly scaled.
* **Y-axis:** Labeled "Mean Up-Clipped Probability", ranging from 0.000 to 0.004. The axis is linearly scaled.
* **Data Series:** A single blue line representing the "Mean Up-Clipped Probability" at each "Step".
* **No Legend:** There is no explicit legend, but the Y-axis label clearly identifies the data series.
### Detailed Analysis
The line chart shows a generally decreasing trend in "Mean Up-Clipped Probability" as "Step" increases.
* **Initial Phase (Step 0-20):** The probability starts at approximately 0.0038 at Step 0 and rapidly decreases to around 0.0025 by Step 20. This is a steep decline.
* **Intermediate Phase (Step 20-60):** The rate of decrease slows down. The probability fluctuates between approximately 0.0018 and 0.0025.
* **Final Phase (Step 60-100):** The probability continues to decrease, but at a very slow rate, leveling off around 0.001. There are minor oscillations in this region.
Approximate data points (with uncertainty of +/- 0.0002):
* Step 0: 0.0038
* Step 10: 0.0031
* Step 20: 0.0025
* Step 30: 0.0022
* Step 40: 0.0020
* Step 50: 0.0018
* Step 60: 0.0016
* Step 70: 0.0014
* Step 80: 0.0012
* Step 90: 0.0011
* Step 100: 0.0010
### Key Observations
* The most significant drop in probability occurs within the first 20 steps.
* After Step 60, the probability stabilizes, showing only minor fluctuations.
* There are no obvious outliers or sudden jumps in the data. The line is relatively smooth.
### Interpretation
The chart likely represents the convergence of a process or algorithm. The "Step" variable could represent iterations or time steps, and the "Mean Up-Clipped Probability" could indicate the likelihood of a certain event or outcome. The decreasing trend suggests that the probability of this event is diminishing as the process progresses. The leveling off at the end indicates that the process is approaching a stable state where the probability remains relatively constant. The "Up-Clipped" aspect suggests that values exceeding a certain threshold are being capped or limited, potentially to prevent instability or overflow. This could be related to a reinforcement learning algorithm, a simulation, or an optimization process. The initial rapid decrease could represent a period of rapid learning or adjustment, followed by a period of refinement and stabilization.