## Line Chart: Mean Up-Clipped Probability vs. Step
### Overview
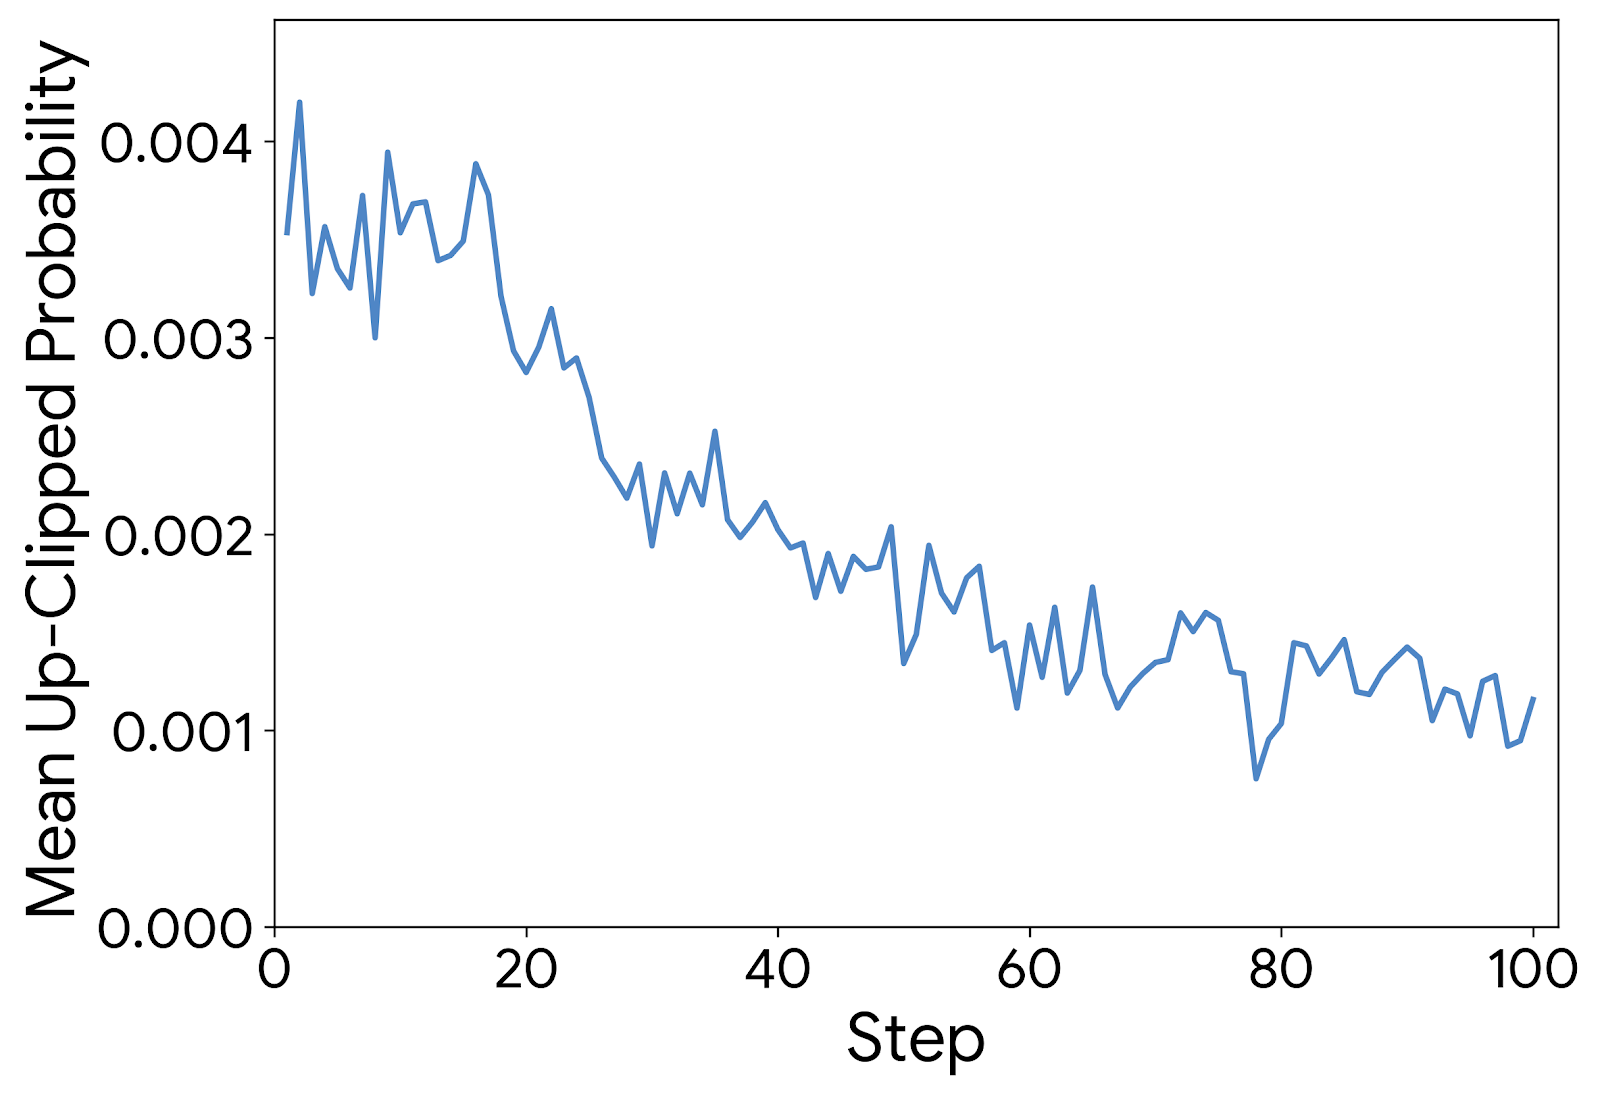
The image displays a single-series line chart plotting "Mean Up-Clipped Probability" against "Step". The chart shows a generally decreasing, yet volatile, trend over 100 steps. The data is presented as a continuous blue line on a white background with black axes and labels.
### Components/Axes
* **Y-Axis (Vertical):**
* **Label:** "Mean Up-Clipped Probability"
* **Scale:** Linear scale ranging from 0.000 to 0.004.
* **Major Ticks:** 0.000, 0.001, 0.002, 0.003, 0.004.
* **X-Axis (Horizontal):**
* **Label:** "Step"
* **Scale:** Linear scale ranging from 0 to 100.
* **Major Ticks:** 0, 20, 40, 60, 80, 100.
* **Data Series:**
* A single, solid blue line representing the "Mean Up-Clipped Probability" at each step.
* **Legend:** No legend is present, as there is only one data series.
### Detailed Analysis
The line exhibits significant high-frequency volatility (noise) superimposed on a clear downward trend.
* **Initial Phase (Steps 0-20):** The line starts at a high value, approximately 0.0035 at Step 0. It immediately spikes to its global maximum of ~0.0042 within the first few steps. This period is characterized by high volatility, with values oscillating roughly between 0.003 and 0.004.
* **Primary Decline (Steps 20-40):** A more pronounced downward trend begins around Step 20. The line descends from ~0.003 to ~0.002, though it continues to show sharp, short-term fluctuations.
* **Gradual Decline with Volatility (Steps 40-100):** From Step 40 onward, the overall slope of the decline becomes less steep, but volatility remains high. The line fluctuates within a narrowing band, trending from ~0.002 down to ~0.001.
* A notable local minimum occurs around Step 78, where the value dips to its lowest point, approximately 0.0008.
* The series ends at Step 100 with a value of approximately 0.0011.
**Approximate Key Data Points (Visual Estimation):**
* Step 0: ~0.0035
* Step ~5 (Global Max): ~0.0042
* Step 20: ~0.0030
* Step 40: ~0.0020
* Step 60: ~0.0015
* Step 78 (Local Min): ~0.0008
* Step 100: ~0.0011
### Key Observations
1. **Dominant Trend:** A clear, long-term decreasing trend in the mean up-clipped probability across the 100 steps.
2. **High Volatility:** The signal is very noisy, with frequent and sharp up-and-down movements from one step to the next. The magnitude of these fluctuations is significant relative to the overall value, especially in the later steps.
3. **Non-Linear Decay:** The rate of decrease is not constant. The decline is steepest between steps 20 and 40 and becomes more gradual thereafter.
4. **Range Contraction:** The overall range of values contracts over time. Early steps span ~0.0012 (0.003 to 0.0042), while later steps (60-100) primarily span ~0.0007 (0.0008 to 0.0015).
### Interpretation
This chart likely visualizes the output of a machine learning or statistical process over sequential iterations (Steps). The "Mean Up-Clipped Probability" suggests a metric related to a model's confidence or the frequency of an event being predicted, where values above a certain threshold are "clipped."
* **What the data suggests:** The process is converging or stabilizing. The decreasing mean probability indicates that, on average, the event being measured is becoming less likely or the model's confidence in a specific outcome is reducing as the process advances.
* **Relationship between elements:** The "Step" axis represents progression through time, training epochs, or sequential decisions. The downward trend in the probability metric is a direct function of this progression.
* **Notable anomalies:** The high volatility is the most striking feature. It indicates that while the overall direction is downward, the process is highly stochastic or sensitive to small changes at each step. The sharp dip around Step 78 could represent a specific event or perturbation in the process, but without external context, it remains an outlier in the trend.
* **Underlying implication:** If this represents a learning algorithm, the trend shows successful learning (reduction of a target probability or error), but the noise suggests the learning signal is weak or the environment is highly variable. The process has not fully stabilized by Step 100, as the line continues to fluctuate.