## Scatter Plot: Reasoning Tokens vs. Problem Size
### Overview
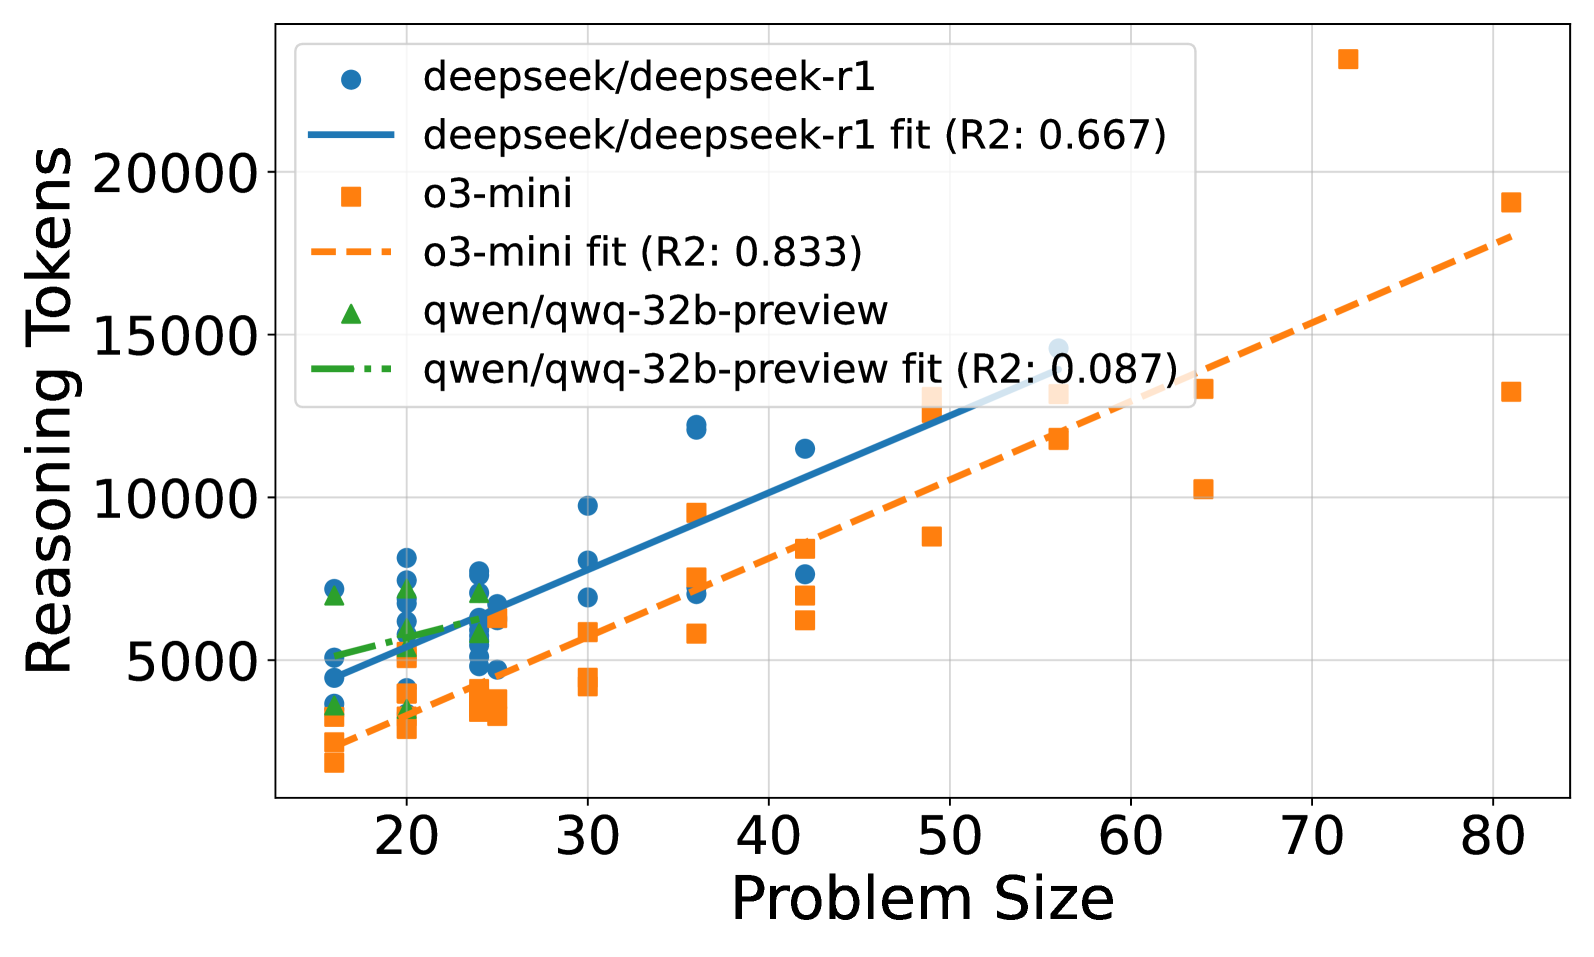
This image presents a scatter plot comparing the number of reasoning tokens generated by different language models (deepseek/deepseek-r1, o3-mini, and qwen/qawq-32b-preview) as a function of problem size. Each model is represented by a different color and shape, with trend lines indicating the overall relationship between problem size and reasoning tokens. R-squared values are provided for each trend line, indicating the goodness of fit.
### Components/Axes
* **X-axis:** Problem Size (ranging from approximately 15 to 85)
* **Y-axis:** Reasoning Tokens (ranging from approximately 2000 to 22000)
* **Legend:** Located in the top-left corner.
* **deepseek/deepseek-r1:** Represented by blue circles.
* **deepseek/deepseek-r1 fit (R2: 0.667):** Represented by a solid blue line.
* **o3-mini:** Represented by orange squares.
* **o3-mini fit (R2: 0.833):** Represented by a dashed orange line.
* **qwen/qawq-32b-preview:** Represented by green triangles.
* **qwen/qawq-32b-preview fit (R2: 0.087):** Represented by a dashed green line.
* **Gridlines:** Present to aid in visual estimation of data point values.
### Detailed Analysis
**deepseek/deepseek-r1 (Blue Circles & Line):**
The blue line slopes generally upward, indicating a positive correlation between problem size and reasoning tokens.
* At Problem Size ≈ 20, Reasoning Tokens ≈ 6000.
* At Problem Size ≈ 30, Reasoning Tokens ≈ 7000.
* At Problem Size ≈ 40, Reasoning Tokens ≈ 8500.
* At Problem Size ≈ 50, Reasoning Tokens ≈ 9500.
* At Problem Size ≈ 60, Reasoning Tokens ≈ 10500.
* At Problem Size ≈ 70, Reasoning Tokens ≈ 12000.
* At Problem Size ≈ 80, Reasoning Tokens ≈ 14000.
**o3-mini (Orange Squares & Line):**
The orange line also slopes upward, but with a steeper gradient than the blue line.
* At Problem Size ≈ 20, Reasoning Tokens ≈ 3000.
* At Problem Size ≈ 30, Reasoning Tokens ≈ 4500.
* At Problem Size ≈ 40, Reasoning Tokens ≈ 6500.
* At Problem Size ≈ 50, Reasoning Tokens ≈ 8500.
* At Problem Size ≈ 60, Reasoning Tokens ≈ 11000.
* At Problem Size ≈ 70, Reasoning Tokens ≈ 14000.
* At Problem Size ≈ 80, Reasoning Tokens ≈ 18000.
**qwen/qawq-32b-preview (Green Triangles & Line):**
The green line is relatively flat, indicating a weak correlation between problem size and reasoning tokens.
* At Problem Size ≈ 20, Reasoning Tokens ≈ 4000.
* At Problem Size ≈ 30, Reasoning Tokens ≈ 4500.
* At Problem Size ≈ 40, Reasoning Tokens ≈ 5000.
* At Problem Size ≈ 50, Reasoning Tokens ≈ 6000.
* At Problem Size ≈ 60, Reasoning Tokens ≈ 8000.
* At Problem Size ≈ 70, Reasoning Tokens ≈ 11000.
* At Problem Size ≈ 80, Reasoning Tokens ≈ 16000.
### Key Observations
* The o3-mini model exhibits the highest number of reasoning tokens for larger problem sizes.
* The qwen/qawq-32b-preview model shows the least sensitivity to problem size, with a relatively constant number of reasoning tokens.
* The R-squared values indicate that the o3-mini model has the best fit to its trend line (0.833), while the qwen/qawq-32b-preview model has a very poor fit (0.087). This suggests that the relationship between problem size and reasoning tokens is not linear for the qwen model.
* There is significant scatter in the data points for all models, indicating that other factors besides problem size may influence the number of reasoning tokens.
### Interpretation
The data suggests that different language models scale differently with problem size in terms of reasoning token usage. The o3-mini model appears to be the most computationally expensive for larger problems, generating significantly more reasoning tokens than the other models. Conversely, the qwen/qawq-32b-preview model is the most efficient, maintaining a relatively constant level of reasoning token usage regardless of problem size. The R-squared values provide a quantitative measure of how well each model's trend line fits the data, with higher values indicating a stronger relationship between problem size and reasoning tokens. The scatter in the data suggests that the relationship is not perfectly linear and that other factors, such as the specific characteristics of the problem, may also play a role. This information is valuable for understanding the computational costs associated with using these models for different types of tasks and for selecting the most appropriate model for a given application. The low R2 value for qwen suggests that a linear model is not appropriate for describing its behavior, and a different functional form might be needed.