## Scatter Plot: Reasoning Tokens vs. Problem Size
### Overview
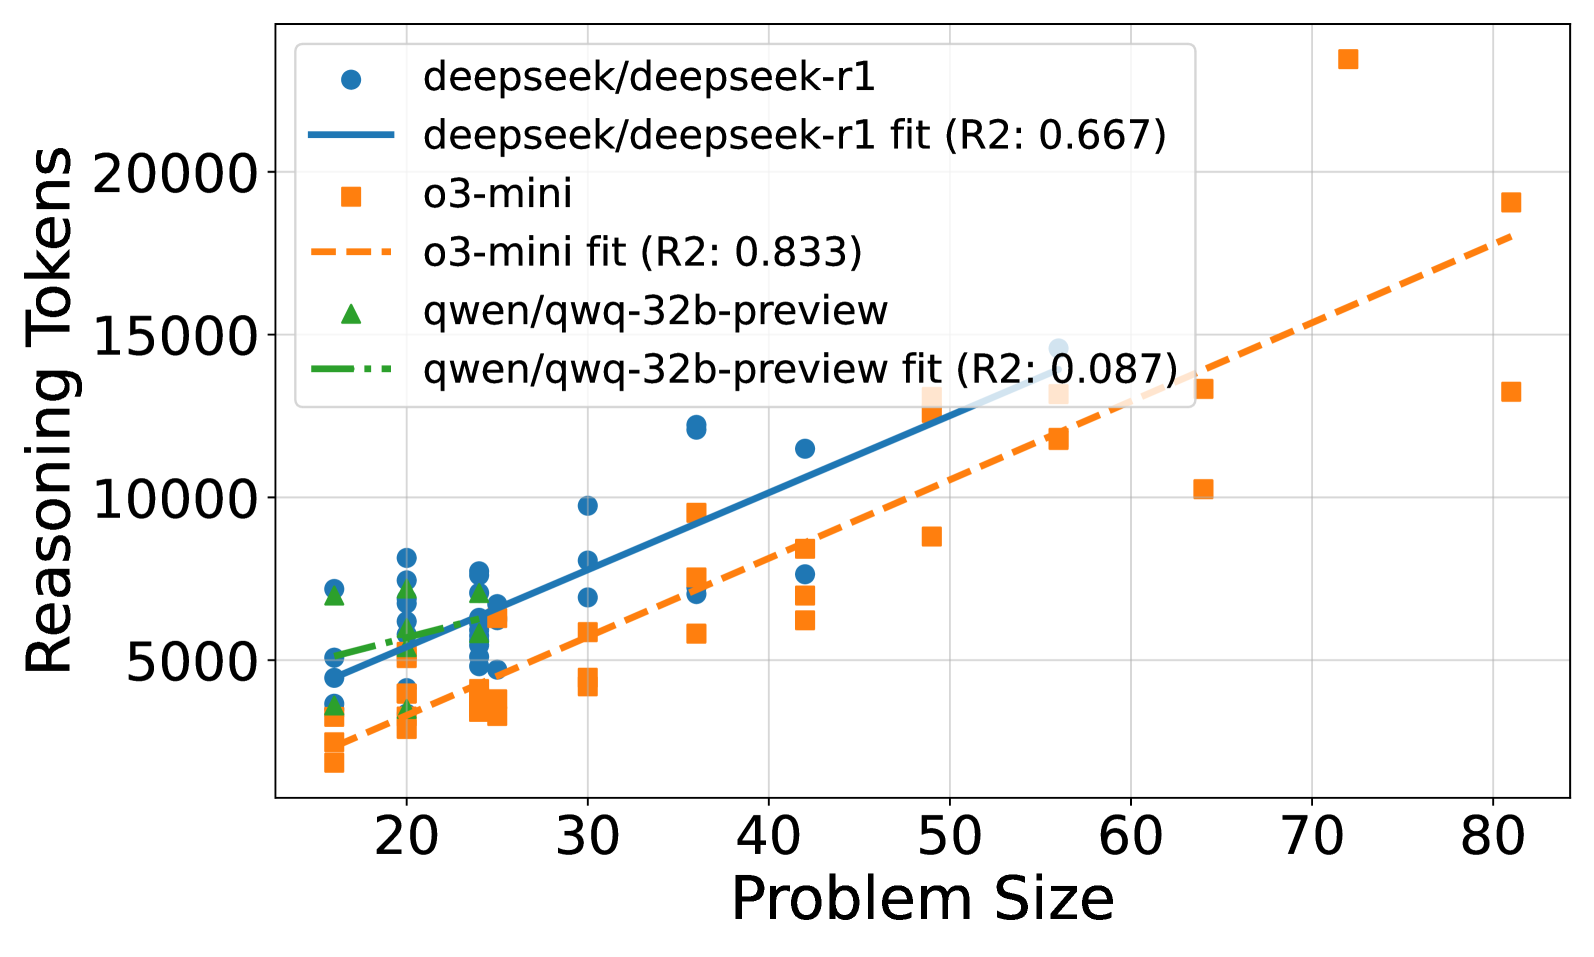
The image is a scatter plot comparing the relationship between problem size (x-axis) and reasoning tokens (y-axis) for two AI models: **deepseek/deepseek-r1** (blue circles) and **o3-mini** (orange squares). Two fitted regression lines are overlaid, along with a legend in the top-left corner. A third dataset (**qwen/qwq-32b-preview**, green triangles) is mentioned in the legend but not plotted.
---
### Components/Axes
- **X-axis (Problem Size)**: Ranges from 20 to 80, with gridlines at intervals of 10.
- **Y-axis (Reasoning Tokens)**: Ranges from 0 to 20,000, with gridlines at intervals of 5,000.
- **Legend**: Located in the top-left corner, with four entries:
1. **Blue circles**: "deepseek/deepseek-r1" (data points).
2. **Solid blue line**: "deepseek/deepseek-r1 fit (R²: 0.667)".
3. **Orange squares**: "o3-mini" (data points).
4. **Dashed orange line**: "o3-mini fit (R²: 0.833)".
5. **Green triangles**: "qwen/qwq-32b-preview" (not plotted).
6. **Dashed green line**: "qwen/qwq-32b-preview fit (R²: 0.087)" (not plotted).
---
### Detailed Analysis
1. **deepseek/deepseek-r1 (Blue Circles)**:
- Data points span x=20 to 60, y=5,000 to 15,000.
- Fitted line (solid blue) shows a moderate upward trend with R² = 0.667.
- Points are scattered but generally follow the line, indicating moderate correlation.
2. **o3-mini (Orange Squares)**:
- Data points span x=20 to 80, y=3,000 to 20,000.
- Fitted line (dashed orange) shows a steep upward trend with R² = 0.833.
- Points align closely with the line, indicating strong correlation.
3. **qwen/qwq-32b-preview (Green Triangles)**:
- Mentioned in the legend but absent from the plot. No data points or fitted line are visible.
---
### Key Observations
- **o3-mini** demonstrates a stronger linear relationship (R² = 0.833) compared to **deepseek/deepseek-r1** (R² = 0.667).
- The **o3-mini** line has a steeper slope, suggesting faster growth in reasoning tokens with increasing problem size.
- **deepseek/deepseek-r1** exhibits more variability in reasoning tokens for similar problem sizes.
- The absence of **qwen/qwq-32b-preview** data suggests it may not be relevant to this analysis or was excluded.
---
### Interpretation
- **Model Efficiency**: **o3-mini** scales more predictably with problem size, making it potentially more efficient for larger tasks. Its high R² value indicates consistent performance.
- **deepseek/deepseek-r1** shows less consistency, with reasoning tokens fluctuating more for equivalent problem sizes. This could imply higher computational variability or sensitivity to input specifics.
- The **qwen/qwq-32b-preview** dataset is referenced but not visualized, raising questions about its exclusion or relevance to the current analysis.
- The plot highlights trade-offs between model architectures in balancing problem size and resource allocation (reasoning tokens).