\n
## Diagram: Kernel Operation Illustration
### Overview
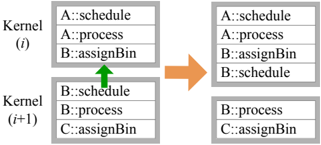
The image depicts a diagram illustrating a kernel operation, likely related to data processing or scheduling. It shows two "Kernel" states, labeled (i) and (i+1), with data elements being rearranged between them. An arrow indicates a data transfer or operation.
### Components/Axes
The diagram consists of two main sections, each representing a "Kernel" state. Each Kernel is represented as a rectangular box containing three rows of text. The text within each row follows the format "Letter::Operation". An upward-pointing green arrow originates from the bottom row of Kernel (i) and points to the bottom row of Kernel (i+1). An orange arrow indicates the overall transformation from Kernel (i) to Kernel (i+1).
### Detailed Analysis or Content Details
**Kernel (i):**
* Row 1: A::schedule
* Row 2: A::process
* Row 3: B::assignBin
* Row 4: B::schedule
**Kernel (i+1):**
* Row 1: A::schedule
* Row 2: A::process
* Row 3: B::assignBin
* Row 4: B::schedule
The green arrow points from "B::schedule" in Kernel (i) to "B::schedule" in Kernel (i+1). The orange arrow indicates a transformation from the left set of Kernels to the right set of Kernels.
### Key Observations
The primary change between Kernel (i) and Kernel (i+1) is the swapping of the last two rows in the first Kernel. The first two rows remain unchanged. The operation appears to be a row swap or a reordering of elements within the kernel.
### Interpretation
This diagram likely illustrates a step in a scheduling or data processing algorithm. The "Kernel" represents a processing unit or a data structure. The operation shown – swapping rows – could represent a task reassignment, a data reordering, or a step in a parallel processing scheme. The labels "schedule", "process", and "assignBin" suggest these are operations performed on data or tasks. The (i) and (i+1) notation indicates a sequential step in an iterative process. The diagram demonstrates a specific transformation of the kernel state, potentially representing a single iteration of an algorithm. The swapping of the rows suggests a dynamic allocation or reordering of resources or tasks. The diagram does not provide quantitative data, but rather a qualitative illustration of a process.