## Line Chart: Test Loss vs. Gradient Updates
### Overview
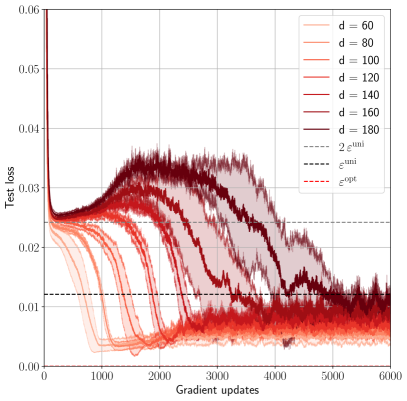
The chart illustrates the convergence behavior of test loss across multiple gradient update iterations (0–6000) for different hyperparameter values (`d`). It includes two reference lines (`ε_uni` and `ε_opt`) and shaded regions representing variability. Higher `d` values (140–180) show faster convergence and lower final loss compared to lower `d` values (60–120).
### Components/Axes
- **X-axis**: Gradient updates (0–6000, increments of 1000).
- **Y-axis**: Test loss (0.00–0.06, increments of 0.01).
- **Legend**:
- Solid lines: `d = 60` (light red) to `d = 180` (dark red).
- Dashed lines: `ε_uni` (horizontal, ~0.01) and `ε_opt` (horizontal, ~0.009).
- **Shaded regions**: Semi-transparent bands around each line, likely representing confidence intervals or variability.
### Detailed Analysis
1. **Initial Drop**: All lines start near 0.06 at 0 updates, dropping sharply within the first 1000 updates.
- Example: `d = 60` drops to ~0.02 by 1000 updates; `d = 180` drops to ~0.015.
2. **Fluctuations**: Post-1000 updates, lines exhibit noisy oscillations, with amplitude decreasing over time.
3. **Convergence**: Higher `d` values (e.g., `d = 180`) stabilize near ~0.01 by 6000 updates, while lower `d` values (e.g., `d = 60`) hover around ~0.02.
4. **Reference Lines**:
- `ε_uni` (dashed gray): Horizontal at ~0.01.
- `ε_opt` (dotted gray): Horizontal at ~0.009.
5. **Shaded Regions**:
- Narrower for higher `d` (e.g., `d = 180` has minimal shading by 6000 updates).
- Wider for lower `d` (e.g., `d = 60` retains significant shading).
### Key Observations
- **Inverse Relationship**: Test loss decreases as `d` increases, with `d = 180` achieving the lowest loss (~0.01).
- **Stability**: Higher `d` values exhibit tighter confidence intervals (narrower shaded regions).
- **Thresholds**: `ε_uni` and `ε_opt` act as benchmarks, with most lines converging below `ε_uni` after 4000 updates.
### Interpretation
The chart demonstrates that increasing the hyperparameter `d` improves model performance (lower test loss) and stability (reduced variability). The shaded regions suggest that higher `d` values yield more reliable loss estimates, likely due to better generalization or regularization. The `ε_uni` and `ε_opt` lines may represent theoretical or empirical thresholds for acceptable loss, with practical performance approaching `ε_opt` for optimal `d` values. The noise in early updates highlights the importance of sufficient gradient steps for convergence.