## Line Chart: Relationship Between Music and Lyrics Token Positions
### Overview
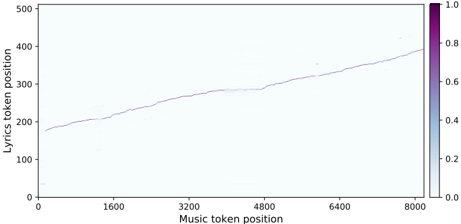
The image depicts a line chart illustrating the relationship between "Music token position" (x-axis) and "Lyrics token position" (y-axis). A single purple line with a gradient color intensity spans the chart, suggesting a variable associated with the data points. The legend on the right indicates a color scale from 0.0 (light purple) to 1.0 (dark purple).
### Components/Axes
- **X-axis (Music token position)**: Ranges from 0 to 8000, with no explicit labels for intermediate values.
- **Y-axis (Lyrics token position)**: Ranges from 0 to 500, with no explicit labels for intermediate values.
- **Legend**: Positioned on the right, with a vertical color bar labeled "0.0" (light purple) to "1.0" (dark purple).
- **Line**: A single purple line with a gradient from light to dark, starting at (0, 180) and ending at (8000, 400).
### Detailed Analysis
- **Line Trend**: The line exhibits a steady upward slope, indicating a proportional relationship between music and lyrics token positions.
- **Color Gradient**: The line’s color intensity increases from left to right, correlating with the x-axis values. The gradient suggests a secondary variable (e.g., confidence, intensity) that increases as music token position increases.
- **Data Points**:
- At x = 0, y = 180 (light purple, ~0.0 on the legend).
- At x = 8000, y = 400 (dark purple, ~1.0 on the legend).
- Intermediate points show gradual increases in both y and color intensity.
### Key Observations
- The line’s consistent upward trajectory implies a linear or near-linear relationship between music and lyrics token positions.
- The color gradient indicates a secondary metric that aligns with the x-axis, though its exact meaning is not explicitly stated.
- No outliers or anomalies are visible; the data appears smooth and continuous.
### Interpretation
The chart likely represents a mapping of token positions in a sequence (e.g., music and lyrics in a song), with the color gradient reflecting an additional dimension such as confidence, relevance, or intensity. The proportional increase in both axes suggests that as music tokens progress, lyrics tokens also advance in a coordinated manner. The legend’s color scale implies that the gradient encodes a normalized value (0.0–1.0), possibly derived from a model’s output or a normalized metric. Without further context, the exact interpretation of the color remains speculative, but it underscores a relationship between the two axes and an additional variable.