## Chart Type: Multiple Line Charts
### Overview
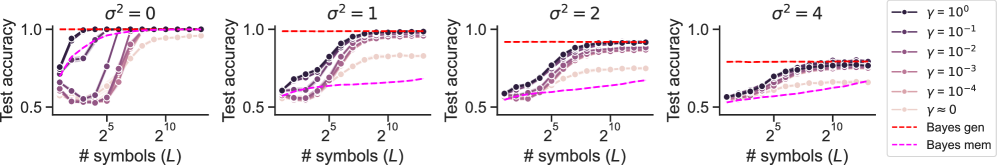
The image contains four line charts arranged horizontally. Each chart displays the "Test accuracy" as a function of "# symbols (L)" for different values of sigma squared (σ²). The charts share a common legend, which indicates the different gamma (γ) values represented by different colored lines, as well as "Bayes gen" and "Bayes mem" lines.
### Components/Axes
* **X-axis (Horizontal):** "# symbols (L)". The scale is logarithmic, with markers at 2^5 and 2^10.
* **Y-axis (Vertical):** "Test accuracy". The scale ranges from 0.5 to 1.0, with markers at 0.5 and 1.0.
* **Titles:** Each chart has a title indicating the value of σ²: σ² = 0, σ² = 1, σ² = 2, and σ² = 4.
* **Legend (Right side of the image):**
* Black: γ = 10⁰
* Dark Gray: γ = 10⁻¹
* Medium Gray: γ = 10⁻²
* Light Gray: γ = 10⁻³
* Very Light Gray: γ = 10⁻⁴
* Almost White Gray: γ ≈ 0
* Dashed Red: Bayes gen
* Dashed Magenta: Bayes mem
### Detailed Analysis
**Chart 1: σ² = 0**
* γ = 10⁰ (Black): Starts at approximately 0.75, quickly rises to 1.0, and remains constant.
* γ = 10⁻¹ (Dark Gray): Starts at approximately 0.6, rises to 1.0, and remains constant.
* γ = 10⁻² (Medium Gray): Starts at approximately 0.5, rises to 1.0, and remains constant.
* γ = 10⁻³ (Light Gray): Starts at approximately 0.5, rises to approximately 0.95, and remains constant.
* γ = 10⁻⁴ (Very Light Gray): Starts at approximately 0.5, rises to approximately 0.95, and remains constant.
* γ ≈ 0 (Almost White Gray): Starts at approximately 0.5, rises to approximately 0.95, and remains constant.
* Bayes gen (Dashed Red): Constant at 1.0.
* Bayes mem (Dashed Magenta): Starts at approximately 0.7, rises to approximately 0.95, and remains constant.
**Chart 2: σ² = 1**
* γ = 10⁰ (Black): Starts at approximately 0.6, rises to approximately 0.95, and remains constant.
* γ = 10⁻¹ (Dark Gray): Starts at approximately 0.55, rises to approximately 0.95, and remains constant.
* γ = 10⁻² (Medium Gray): Starts at approximately 0.5, rises to approximately 0.9, and remains constant.
* γ = 10⁻³ (Light Gray): Starts at approximately 0.5, rises to approximately 0.8, and remains constant.
* γ = 10⁻⁴ (Very Light Gray): Starts at approximately 0.5, rises to approximately 0.75, and remains constant.
* γ ≈ 0 (Almost White Gray): Not visible.
* Bayes gen (Dashed Red): Constant at approximately 0.95.
* Bayes mem (Dashed Magenta): Starts at approximately 0.6, rises to approximately 0.7, and remains constant.
**Chart 3: σ² = 2**
* γ = 10⁰ (Black): Starts at approximately 0.6, rises to approximately 0.9, and remains constant.
* γ = 10⁻¹ (Dark Gray): Starts at approximately 0.55, rises to approximately 0.85, and remains constant.
* γ = 10⁻² (Medium Gray): Starts at approximately 0.5, rises to approximately 0.75, and remains constant.
* γ = 10⁻³ (Light Gray): Starts at approximately 0.5, rises to approximately 0.65, and remains constant.
* γ = 10⁻⁴ (Very Light Gray): Starts at approximately 0.5, rises to approximately 0.6, and remains constant.
* γ ≈ 0 (Almost White Gray): Not visible.
* Bayes gen (Dashed Red): Constant at approximately 0.9.
* Bayes mem (Dashed Magenta): Starts at approximately 0.55, rises to approximately 0.6, and remains constant.
**Chart 4: σ² = 4**
* γ = 10⁰ (Black): Starts at approximately 0.6, rises to approximately 0.8, and remains constant.
* γ = 10⁻¹ (Dark Gray): Starts at approximately 0.55, rises to approximately 0.75, and remains constant.
* γ = 10⁻² (Medium Gray): Starts at approximately 0.5, rises to approximately 0.7, and remains constant.
* γ = 10⁻³ (Light Gray): Starts at approximately 0.5, rises to approximately 0.6, and remains constant.
* γ = 10⁻⁴ (Very Light Gray): Not visible.
* γ ≈ 0 (Almost White Gray): Not visible.
* Bayes gen (Dashed Red): Constant at approximately 0.75.
* Bayes mem (Dashed Magenta): Starts at approximately 0.55, rises to approximately 0.6, and remains constant.
### Key Observations
* As σ² increases, the test accuracy generally decreases for all values of γ.
* Higher values of γ (γ = 10⁰, γ = 10⁻¹) tend to achieve higher test accuracy compared to lower values of γ.
* The "Bayes gen" line represents a theoretical upper bound on the test accuracy, which decreases as σ² increases.
* The "Bayes mem" line generally shows the lowest test accuracy and remains relatively flat across different numbers of symbols.
* The test accuracy tends to plateau as the number of symbols increases, especially for higher values of σ².
### Interpretation
The charts illustrate the relationship between test accuracy, the number of symbols (L), the noise level (σ²), and the regularization parameter (γ). The data suggests that increasing the noise level (σ²) reduces the achievable test accuracy. Higher values of the regularization parameter (γ) generally improve test accuracy, but the effect diminishes as σ² increases. The "Bayes gen" line indicates the theoretical limit of performance, which is also affected by the noise level. The "Bayes mem" line likely represents a baseline performance achieved by a simple memorization strategy. The plots demonstrate the trade-off between model complexity (controlled by γ) and generalization ability in the presence of noise.