## Chart: Test Accuracy vs. Number of Symbols
### Overview
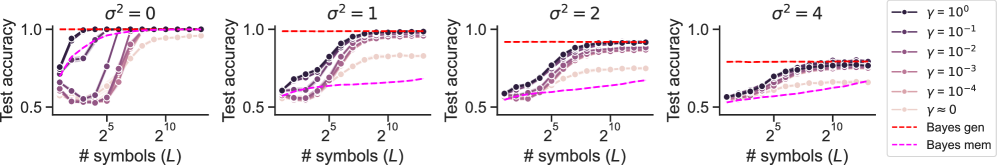
The image presents a series of four line plots, each representing the relationship between test accuracy and the number of symbols (L) under different noise conditions (σ²) and regularization strengths (γ). Each plot displays two data series: "Bayes gen" (represented by solid lines) and "Bayes mem" (represented by dashed lines), with multiple lines within each series corresponding to different values of γ. A horizontal dashed red line at y=1.0 indicates perfect accuracy.
### Components/Axes
* **X-axis:** "# symbols (L)" - Number of symbols, plotted on a logarithmic scale from approximately 2 to 100.
* **Y-axis:** "Test accuracy" - Ranges from 0 to 1.1, representing the accuracy of the test.
* **Plots:** Four separate plots, each with a title indicating the value of σ² (variance): σ² = 0, σ² = 1, σ² = 2, σ² = 4.
* **Legend:** Located in the top-right corner, listing the values of γ (regularization strength): γ = 10⁰, γ = 10⁻¹, γ = 10⁻², γ = 10⁻³, γ = 10⁻⁴, and γ = 0.
* **Data Series:**
* "Bayes gen" (solid lines)
* "Bayes mem" (dashed lines)
### Detailed Analysis
**Plot 1: σ² = 0**
* **Bayes gen:**
* γ = 10⁰ (red): Starts at approximately 0.5, quickly rises to 1.0 and remains there.
* γ = 10⁻¹ (orange): Starts at approximately 0.5, rises to around 0.95, and plateaus.
* γ = 10⁻² (yellow): Starts at approximately 0.5, rises to around 0.85, and plateaus.
* γ = 10⁻³ (green): Starts at approximately 0.5, rises to around 0.75, and plateaus.
* γ = 10⁻⁴ (blue): Starts at approximately 0.5, rises to around 0.65, and plateaus.
* γ = 0 (purple): Starts at approximately 0.5, rises to around 0.6, and plateaus.
* **Bayes mem:**
* γ = 10⁰ (red): Starts at approximately 0.5, rises to 1.0 and remains there.
* γ = 10⁻¹ (orange): Starts at approximately 0.5, rises to around 0.95, and plateaus.
* γ = 10⁻² (yellow): Starts at approximately 0.5, rises to around 0.85, and plateaus.
* γ = 10⁻³ (green): Starts at approximately 0.5, rises to around 0.75, and plateaus.
* γ = 10⁻⁴ (blue): Starts at approximately 0.5, rises to around 0.65, and plateaus.
* γ = 0 (purple): Starts at approximately 0.5, rises to around 0.6, and plateaus.
**Plot 2: σ² = 1**
* **Bayes gen:** Similar trend to σ² = 0, but the lines reach lower maximum accuracy values.
* **Bayes mem:** Similar trend to σ² = 0, but the lines reach lower maximum accuracy values.
**Plot 3: σ² = 2**
* **Bayes gen:** Similar trend to σ² = 1, but the lines reach even lower maximum accuracy values.
* **Bayes mem:** Similar trend to σ² = 1, but the lines reach even lower maximum accuracy values.
**Plot 4: σ² = 4**
* **Bayes gen:** Similar trend to σ² = 2, but the lines reach even lower maximum accuracy values.
* **Bayes mem:** Similar trend to σ² = 2, but the lines reach even lower maximum accuracy values.
In all plots, the lines generally slope upwards, indicating that increasing the number of symbols (L) improves test accuracy. However, the rate of improvement decreases as L increases, and the maximum achievable accuracy decreases as σ² increases. The lines corresponding to higher values of γ (stronger regularization) tend to plateau at lower accuracy values.
### Key Observations
* As the noise level (σ²) increases, the maximum achievable test accuracy decreases.
* Stronger regularization (higher γ) generally leads to lower maximum accuracy, but can prevent overfitting for smaller values of L.
* Both "Bayes gen" and "Bayes mem" show similar trends, but "Bayes gen" consistently achieves slightly higher accuracy than "Bayes mem" for a given set of parameters.
* The effect of γ is more pronounced at lower values of L.
### Interpretation
The data suggests that the performance of the Bayesian models is sensitive to both noise and regularization. Increasing the number of symbols generally improves accuracy, but the benefit diminishes as the number of symbols grows. The optimal level of regularization depends on the noise level and the number of symbols. In a low-noise environment (σ² = 0), strong regularization can hinder performance, while in a noisy environment (σ² = 4), regularization may be necessary to prevent overfitting. The slight difference in performance between "Bayes gen" and "Bayes mem" could indicate that one approach is more robust to noise or better suited for the given task. The logarithmic scale on the x-axis suggests that the initial increase in accuracy with a small number of symbols is more significant than the increase with a large number of symbols. This could be due to the diminishing returns of adding more symbols once a certain level of information has been captured.