## Line Graphs: Test Accuracy vs. Number of Symbols (L) for Different Noise Levels (σ²)
### Overview
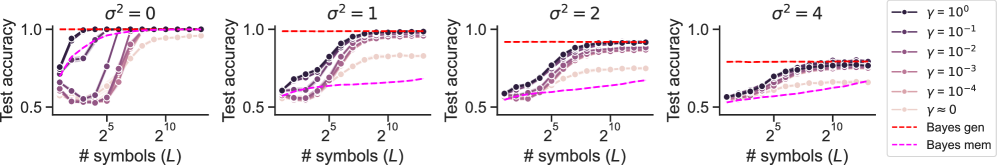
The image contains four line graphs comparing test accuracy against the number of symbols (L) for different noise levels (σ² = 0, 1, 2, 4). Each graph includes multiple data series representing different γ values (γ = 10⁰ to 10⁻⁴) and two Bayesian methods ("Bayes gen" and "Bayes mem"). The graphs use a logarithmic scale for L (2⁵ to 2¹⁰) and a linear scale for test accuracy (0.5 to 1.0).
---
### Components/Axes
- **X-axis**: "# symbols (L)" (logarithmic scale: 2⁵ to 2¹⁰)
- **Y-axis**: "Test accuracy" (linear scale: 0.5 to 1.0)
- **Legend**:
- Colors represent γ values (10⁰ to 10⁻⁴) and Bayesian methods.
- Line styles: Solid circles (γ values), dashed lines (Bayesian methods).
- **Graph Titles**: Each graph is labeled with σ² (0, 1, 2, 4) at the top.
---
### Detailed Analysis
#### σ² = 0
- **Trend**: All γ values and Bayesian methods converge to near-perfect accuracy (≈1.0) as L increases.
- **Key Data Points**:
- γ = 10⁰: Starts at ~0.6 (L=2⁵), plateaus at ~1.0 (L=2¹⁰).
- Bayes gen (dashed red): Consistently near 1.0 across all L.
- Bayes mem (dashed magenta): Slightly lower than Bayes gen but still approaches 1.0.
#### σ² = 1
- **Trend**: Test accuracy decreases with higher σ². Lower γ values (e.g., 10⁻⁴) perform worse.
- **Key Data Points**:
- γ = 10⁰: Starts at ~0.7 (L=2⁵), reaches ~0.95 (L=2¹⁰).
- Bayes gen: Peaks at ~0.98 (L=2¹⁰).
- Bayes mem: Peaks at ~0.92 (L=2¹⁰).
#### σ² = 2
- **Trend**: Further drop in accuracy. γ = 10⁻⁴ struggles to exceed 0.6.
- **Key Data Points**:
- γ = 10⁰: Starts at ~0.65 (L=2⁵), reaches ~0.85 (L=2¹⁰).
- Bayes gen: Peaks at ~0.95 (L=2¹⁰).
- Bayes mem: Peaks at ~0.88 (L=2¹⁰).
#### σ² = 4
- **Trend**: Significant accuracy degradation. γ = 10⁻⁴ remains below 0.5.
- **Key Data Points**:
- γ = 10⁰: Starts at ~0.55 (L=2⁵), reaches ~0.75 (L=2¹⁰).
- Bayes gen: Peaks at ~0.88 (L=2¹⁰).
- Bayes mem: Peaks at ~0.80 (L=2¹⁰).
---
### Key Observations
1. **Noise Impact**: Higher σ² values consistently reduce test accuracy across all γ and methods.
2. **γ Sensitivity**: Lower γ values (e.g., 10⁻⁴) underperform, especially at high σ².
3. **Bayesian Methods**:
- "Bayes gen" (dashed red) consistently outperforms "Bayes mem" (dashed magenta) under noise.
- Both methods degrade with increasing σ² but remain above γ-based lines.
---
### Interpretation
- **Noise Robustness**: The graphs demonstrate that noise (σ²) directly degrades model performance, with γ-based methods being more sensitive than Bayesian approaches.
- **Bayesian Adaptability**: "Bayes gen" likely adapts better to noise than "Bayes mem," as evidenced by its higher accuracy across σ² levels.
- **γ Trade-off**: Lower γ values (e.g., 10⁻⁴) may underfit, while higher γ (e.g., 10⁰) balances bias-variance trade-offs better under noise.
The data suggests that Bayesian methods with adaptive γ (Bayes gen) are more robust to noise than fixed γ models or memory-based Bayesian approaches (Bayes mem).