\n
## Bar Chart: Qwen2.5-7B-Instruct Model Performance
### Overview
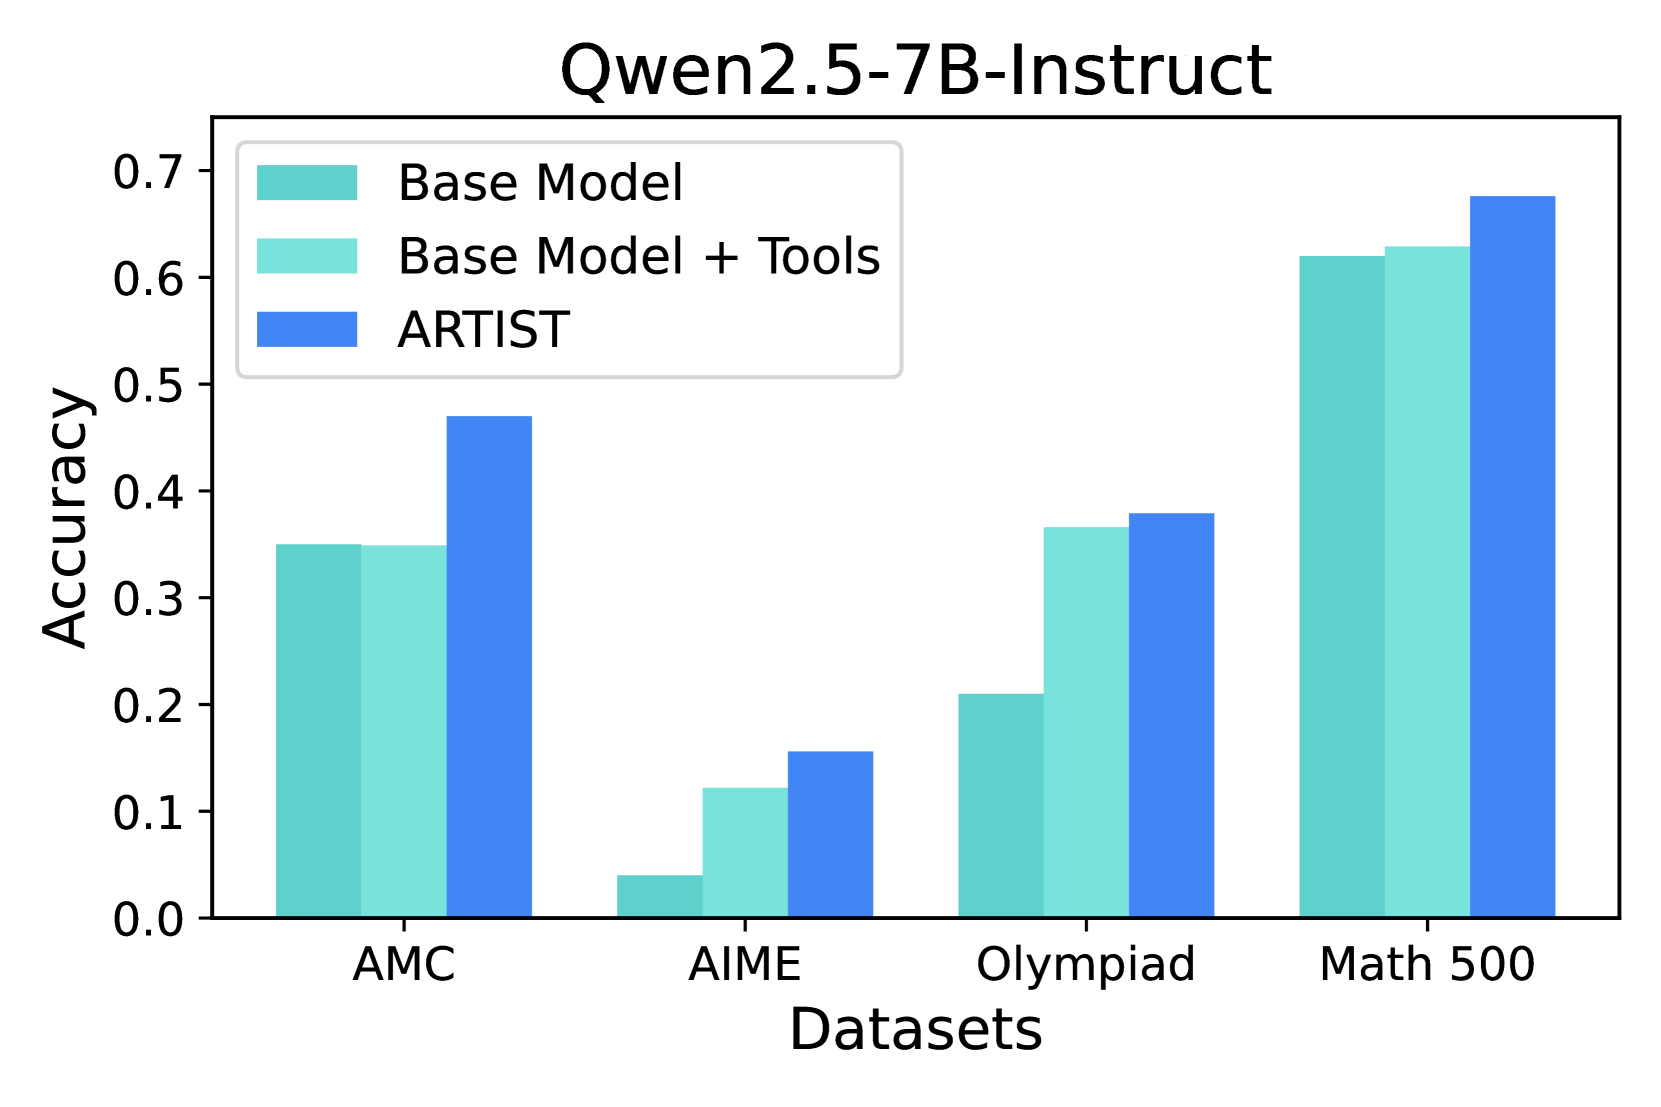
This is a grouped bar chart comparing the accuracy of three different configurations of the "Qwen2.5-7B-Instruct" model across four distinct mathematical reasoning datasets. The chart visually demonstrates the performance impact of using tools and the ARTIST method.
### Components/Axes
* **Chart Title:** "Qwen2.5-7B-Instruct" (centered at the top).
* **Y-Axis:** Labeled "Accuracy". The scale runs from 0.0 to 0.7, with major tick marks at every 0.1 interval.
* **X-Axis:** Labeled "Datasets". It contains four categorical groups:
1. AMC
2. AIME
3. Olympiad
4. Math 500
* **Legend:** Positioned in the top-left corner of the plot area. It defines three data series by color:
* **Base Model:** Represented by a teal/turquoise bar (approximate hex: #66c2a5).
* **Base Model + Tools:** Represented by a light teal/aquamarine bar (approximate hex: #abdda4).
* **ARTIST:** Represented by a medium blue bar (approximate hex: #3288bd).
### Detailed Analysis
For each dataset, the approximate accuracy values (read from the y-axis) for the three models are as follows:
**1. AMC Dataset:**
* **Base Model:** ~0.35
* **Base Model + Tools:** ~0.35 (appears equal to Base Model)
* **ARTIST:** ~0.47
* *Trend:* ARTIST shows a clear improvement over the base configurations, which perform identically.
**2. AIME Dataset:**
* **Base Model:** ~0.04
* **Base Model + Tools:** ~0.12
* **ARTIST:** ~0.16
* *Trend:* All accuracies are significantly lower than on other datasets, indicating higher difficulty. There is a stepwise improvement from Base Model to Base Model + Tools to ARTIST.
**3. Olympiad Dataset:**
* **Base Model:** ~0.21
* **Base Model + Tools:** ~0.37
* **ARTIST:** ~0.38
* *Trend:* A substantial jump in performance is observed when adding tools to the base model. ARTIST provides a very slight additional improvement over "Base Model + Tools."
**4. Math 500 Dataset:**
* **Base Model:** ~0.62
* **Base Model + Tools:** ~0.63
* **ARTIST:** ~0.68
* *Trend:* This dataset yields the highest overall accuracies. The base model and base model with tools perform very similarly, while ARTIST shows a notable improvement.
### Key Observations
1. **Consistent Superiority of ARTIST:** The ARTIST method (blue bar) achieves the highest accuracy on every single dataset presented.
2. **Variable Impact of Tools:** The benefit of adding tools ("Base Model + Tools" vs. "Base Model") is highly dataset-dependent. It provides a large boost on AIME and Olympiad, a minimal boost on Math 500, and no discernible boost on AMC.
3. **Dataset Difficulty Hierarchy:** Based on the performance of the base model, the datasets appear to be ordered by increasing difficulty: Math 500 (easiest, ~0.62) > AMC (~0.35) > Olympiad (~0.21) > AIME (hardest, ~0.04).
4. **Performance Clustering:** On the Math 500 dataset, all three models perform relatively well and within a ~0.06 accuracy range. On the AIME dataset, all models perform poorly, within a ~0.12 range.
### Interpretation
The data strongly suggests that the **ARTIST** method is a more effective technique for improving the mathematical reasoning accuracy of the Qwen2.5-7B-Instruct model than simply augmenting it with tools. The value of tool use is context-specific, proving crucial for certain types of problems (likely those in AIME and Olympiad that benefit from external calculation or verification) but less impactful for others.
The stark difference in baseline performance across datasets highlights the importance of benchmark diversity; a model's capability is not a single number but a profile across problem types. The fact that ARTIST provides the largest relative gains on the hardest dataset (AIME) is particularly significant, as it indicates the method's potential for tackling the most challenging reasoning tasks where base models struggle the most. The chart ultimately makes a case for the ARTIST approach as a robust and consistent performance enhancer.