## Line Graphs: Comparison of ECE and AUROC Across Hint Counts
### Overview
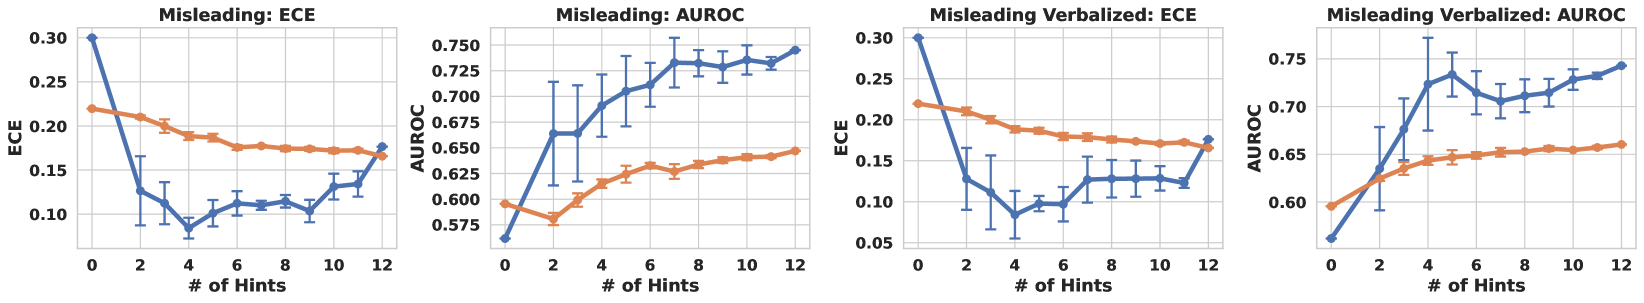
The image contains four line graphs comparing two metrics (ECE and AUROC) across 13 hint counts (0–12). Each graph represents a different experimental condition: "Misleading: ECE," "Misleading: AUROC," "Misleading Verbalized: ECE," and "Misleading Verbalized: AUROC." The graphs use blue lines for ECE and orange lines for AUROC, with error bars indicating variability.
### Components/Axes
- **X-axis**: Number of Hints (0, 2, 4, ..., 12)
- **Y-axes**:
- Left: ECE (Error in Calibration Error)
- Right: AUROC (Area Under the Receiver Operating Characteristic Curve)
- **Legends**:
- Blue = ECE
- Orange = AUROC
- **Placement**:
- Legends are positioned on the right side of each graph.
- X-axis labels are at the bottom; Y-axis labels are on the left.
### Detailed Analysis
#### 1. Misleading: ECE
- **ECE (Blue)**: Starts at ~0.30 (0 hints), drops sharply to ~0.10 (4 hints), then fluctuates between ~0.10–0.15 (8–12 hints).
- **AUROC (Orange)**: Remains relatively stable, starting at ~0.60 (0 hints) and increasing slightly to ~0.65 (12 hints).
- **Error Bars**: Largest variability in ECE at 0 and 12 hints.
#### 2. Misleading: AUROC
- **ECE (Blue)**: Increases steadily from ~0.575 (0 hints) to ~0.75 (12 hints), with a steep rise between 0–4 hints.
- **AUROC (Orange)**: Rises gradually from ~0.575 (0 hints) to ~0.65 (12 hints), with smaller increments.
- **Error Bars**: Largest variability in ECE at 0 and 12 hints.
#### 3. Misleading Verbalized: ECE
- **ECE (Blue)**: Starts at ~0.30 (0 hints), drops to ~0.10 (4 hints), then stabilizes between ~0.10–0.15 (8–12 hints).
- **AUROC (Orange)**: Remains flat, starting at ~0.60 (0 hints) and ending at ~0.65 (12 hints).
- **Error Bars**: Largest variability in ECE at 0 and 12 hints.
#### 4. Misleading Verbalized: AUROC
- **ECE (Blue)**: Increases from ~0.575 (0 hints) to ~0.75 (12 hints), with a sharp rise between 0–4 hints.
- **AUROC (Orange)**: Rises gradually from ~0.575 (0 hints) to ~0.65 (12 hints), with smaller increments.
- **Error Bars**: Largest variability in ECE at 0 and 12 hints.
### Key Observations
1. **ECE Trends**:
- Non-verbalized conditions show sharper declines in ECE with increasing hints (e.g., ~0.30 → ~0.10 in "Misleading: ECE").
- Verbalized conditions exhibit similar trends but with less variability.
2. **AUROC Trends**:
- AUROC improves modestly with more hints in all conditions, but the rate of improvement is slower than ECE.
3. **Error Bars**:
- Variability is highest at extreme hint counts (0 and 12), suggesting uncertainty in measurements at these points.
4. **Color Consistency**:
- Blue lines (ECE) and orange lines (AUROC) match the legend across all graphs.
### Interpretation
- **Trade-off Between Metrics**: Increasing hints generally reduces ECE (improving calibration) but only modestly improves AUROC (model performance), indicating a potential trade-off between calibration and performance.
- **Impact of Verbalization**: Verbalized conditions show slightly more stable ECE trends, suggesting that verbalization may mitigate misleading effects.
- **Outliers**: The sharp drop in ECE at 4 hints in non-verbalized conditions (e.g., "Misleading: ECE") could indicate a threshold effect where hints begin to meaningfully reduce calibration error.
- **Practical Implications**: The data suggests that hint count optimization could prioritize calibration (ECE) over performance (AUROC), depending on the application's needs.