## Line Chart: D8 Per-Layer Q-Projection α Trajectories
### Overview
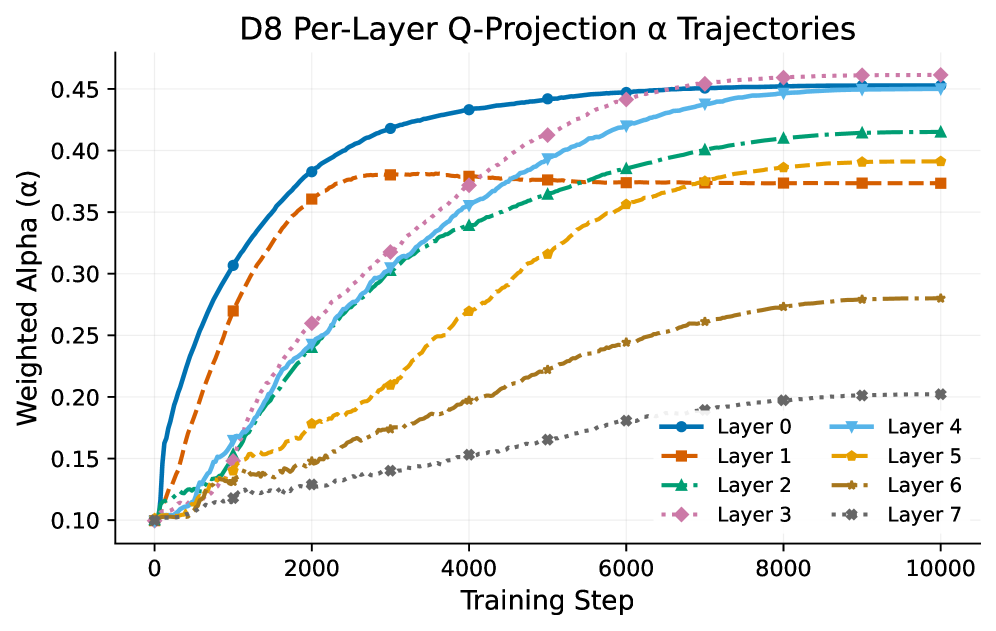
The chart visualizes the evolution of weighted alpha (α) values across eight layers (0–7) during training steps (0–10,000). Each layer is represented by a distinct colored line with unique markers. The y-axis (Weighted Alpha) ranges from 0.10 to 0.45, while the x-axis (Training Step) spans 0 to 10,000. All lines exhibit upward trends, with varying rates of increase and plateauing behavior.
### Components/Axes
- **X-Axis**: Training Step (0–10,000, linear scale)
- **Y-Axis**: Weighted Alpha (α) (0.10–0.45, linear scale)
- **Legend**: Located on the right, mapping colors/markers to layers:
- Layer 0: Blue circles (●)
- Layer 1: Orange squares (■)
- Layer 2: Green triangles (▲)
- Layer 3: Pink diamonds (◆)
- Layer 4: Light blue crosses (✗)
- Layer 5: Yellow dashed line (━━)
- Layer 6: Brown dotted line (···)
- Layer 7: Gray dashed-dotted line (⋯)
### Detailed Analysis
1. **Layer 0 (Blue ●)**:
- Starts at ~0.10, rises sharply to ~0.45 by 2,000 steps, then plateaus.
- Final value at 10,000 steps: ~0.45.
2. **Layer 1 (Orange ■)**:
- Begins at ~0.10, increases to ~0.38 by 4,000 steps, then stabilizes.
- Final value: ~0.38.
3. **Layer 2 (Green ▲)**:
- Gradual ascent from ~0.10 to ~0.40 by 8,000 steps.
- Final value: ~0.40.
4. **Layer 3 (Pink ◆)**:
- Sharp rise from ~0.10 to ~0.45 by 6,000 steps, then plateaus.
- Final value: ~0.45.
5. **Layer 4 (Light Blue ✗)**:
- Steady increase from ~0.10 to ~0.44 by 10,000 steps.
- Final value: ~0.44.
6. **Layer 5 (Yellow ━━)**:
- Slow rise from ~0.10 to ~0.38 by 10,000 steps.
- Final value: ~0.38.
7. **Layer 6 (Brown ···)**:
- Gradual increase from ~0.10 to ~0.28 by 10,000 steps.
- Final value: ~0.28.
8. **Layer 7 (Gray ⋯)**:
- Slowest ascent, reaching ~0.20 by 10,000 steps.
- Final value: ~0.20.
### Key Observations
- **Early Plateauing**: Layers 0 and 3 stabilize quickly (by ~2,000–6,000 steps), suggesting rapid convergence.
- **Layer 7 Lags**: Layer 7 remains the lowest throughout training, indicating slower optimization.
- **Layer 4 Dominance**: Layer 4 achieves the highest final α (~0.44) despite starting later in acceleration.
- **Divergent Trajectories**: Layers 0–3 converge to higher α values than layers 4–7, implying architectural or positional differences in optimization dynamics.
### Interpretation
The chart demonstrates that higher layers (0–3) stabilize earlier and achieve higher α values, likely due to their proximity to output layers in a deep network, which may receive stronger gradient signals during backpropagation. Lower layers (4–7) exhibit prolonged training dynamics, possibly reflecting challenges in optimizing deeper representations. The divergence in convergence rates highlights the importance of layer-specific optimization strategies in deep learning models. Layer 4’s late acceleration suggests it may benefit from later-stage training adjustments, while Layer 7’s persistent lag could indicate architectural bottlenecks or insufficient training duration.