## Acoustic Loss on Codebook-0
### Overview
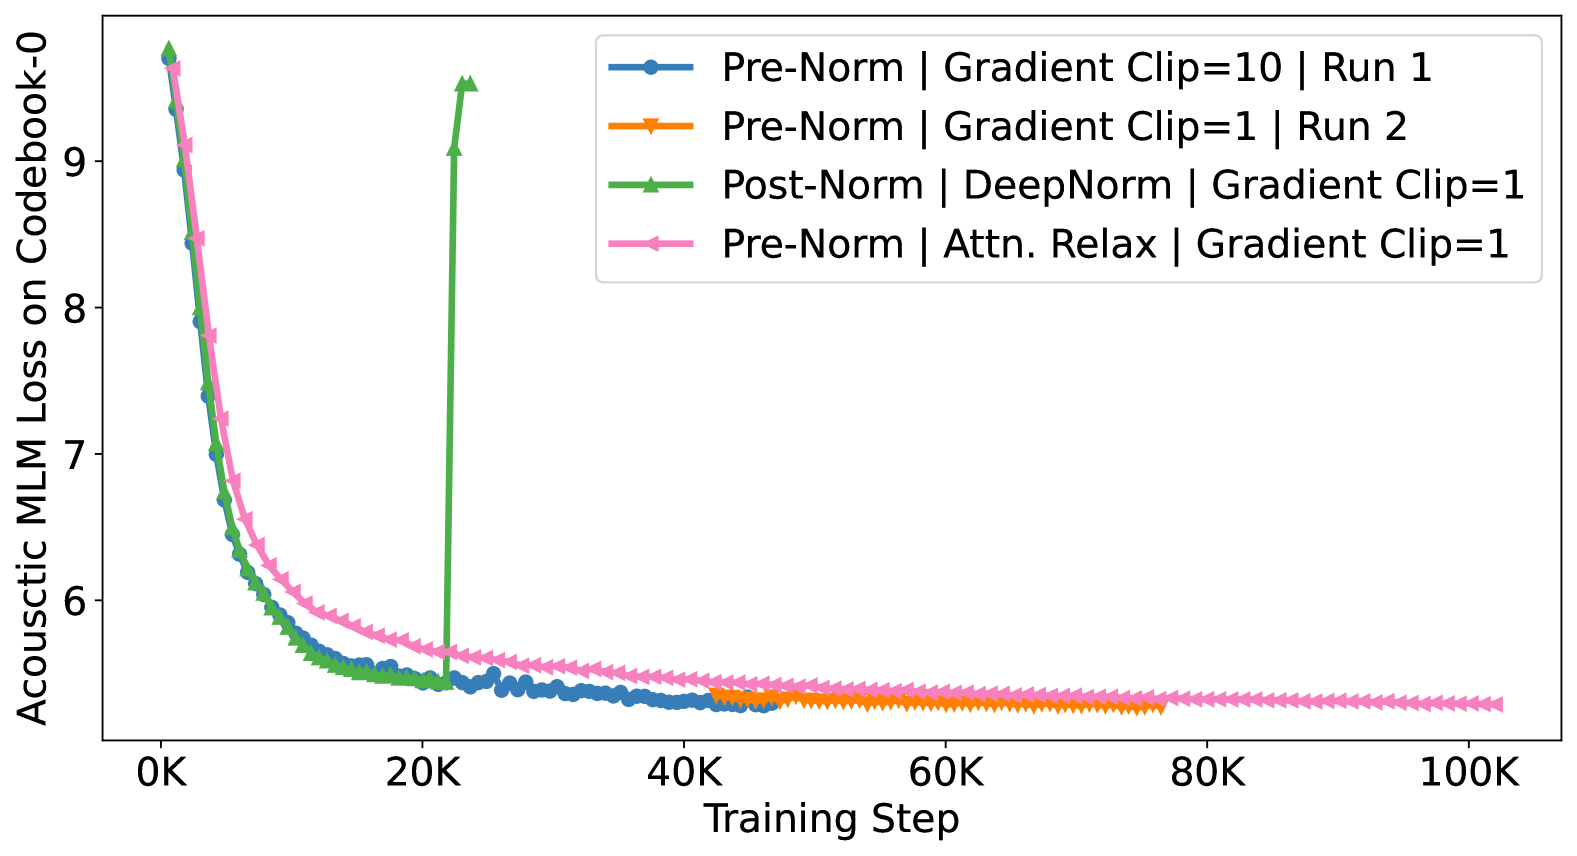
The graph shows the acoustic loss over training steps for different configurations of a model on the Codebook-0 dataset. The loss is measured in decibels (dB) and is plotted against the number of training steps.
### Components/Axes
- **Y-axis**: Acoustic Loss in dB
- **X-axis**: Training Step
- **Legend**: Different configurations of the model with their respective settings (e.g., Pre-Norm, Gradient Clip, Run 1, etc.)
### Detailed Analysis or ### Content Details
- **Pre-Norm**: The loss decreases sharply at the beginning of training and then stabilizes.
- **Gradient Clip=10**: Similar to Pre-Norm, but with a slightly higher initial loss.
- **Post-Norm**: Shows a more gradual decrease in loss.
- **DeepNorm**: The loss decreases more steeply than Post-Norm.
- **Attn. Relax**: The loss decreases the most, indicating the best performance among the configurations.
### Key Observations
- **Pre-Norm and Gradient Clip=10**: Show the highest loss, indicating the worst performance.
- **Post-Norm and DeepNorm**: Show moderate loss, indicating good performance.
- **Attn. Relax**: Shows the lowest loss, indicating the best performance.
### Interpretation
The data suggests that the model's performance is significantly affected by the normalization technique used. The "Attn. Relax" configuration, which likely includes attention mechanisms and relaxation techniques, results in the lowest loss, indicating the best performance. The "Pre-Norm" and "Gradient Clip=10" configurations show the highest loss, indicating the worst performance. The "Post-Norm" and "DeepNorm" configurations show moderate performance. The graph provides insights into the effectiveness of different normalization techniques in improving the model's performance on the Codebook-0 dataset.