## Scatter Chart: Scaling: Bits of Knowledge vs. Params
### Overview
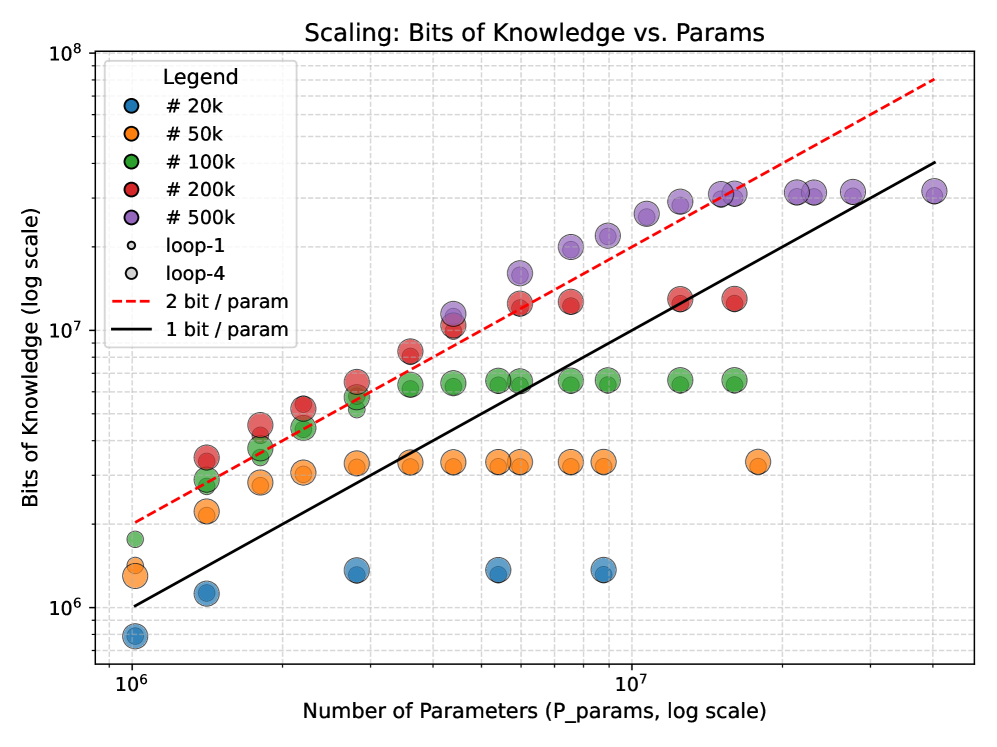
The image is a scatter plot showing the relationship between the number of parameters (P_params) and bits of knowledge, both on a logarithmic scale. Different colored data points represent different model sizes (#20k, #50k, #100k, #200k, #500k) and loop configurations (loop-1, loop-4). Two reference lines, "2 bit / param" and "1 bit / param", are also plotted.
### Components/Axes
* **Title:** Scaling: Bits of Knowledge vs. Params
* **X-axis:** Number of Parameters (P_params, log scale)
* Scale: Logarithmic, ranging from approximately 10^6 to 10^8. Axis markers are present at 10^6 and 10^7.
* **Y-axis:** Bits of Knowledge (log scale)
* Scale: Logarithmic, ranging from approximately 10^6 to 10^8. Axis markers are present at 10^6, 10^7, and 10^8.
* **Legend:** Located in the top-left corner.
* Blue: # 20k
* Orange: # 50k
* Green: # 100k
* Red: # 200k
* Purple: # 500k
* White with black outline: loop-1
* White with black outline: loop-4
* Red dashed line: 2 bit / param
* Black solid line: 1 bit / param
### Detailed Analysis
* **# 20k (Blue):** The blue data points representing "# 20k" are clustered at the lower-left of the chart. The trend is generally flat, with bits of knowledge around 10^6 for parameter counts between 10^6 and 10^7.
* **# 50k (Orange):** The orange data points representing "# 50k" are positioned above the blue points. The trend is also relatively flat, with bits of knowledge around 2 * 10^6 for parameter counts between 10^6 and 10^7.
* **# 100k (Green):** The green data points representing "# 100k" show a slight upward trend. Bits of knowledge range from approximately 2 * 10^6 to 6 * 10^6 as the number of parameters increases from 10^6 to 10^7.
* **# 200k (Red):** The red data points representing "# 200k" show a more pronounced upward trend. Bits of knowledge range from approximately 4 * 10^6 to 2 * 10^7 as the number of parameters increases from 10^6 to 2 * 10^7.
* **# 500k (Purple):** The purple data points representing "# 500k" exhibit the strongest upward trend. Bits of knowledge range from approximately 10^7 to 4 * 10^7 as the number of parameters increases from 2 * 10^6 to 2 * 10^7.
* **loop-1 (White with black outline):** The "loop-1" data points are scattered.
* **loop-4 (White with black outline):** The "loop-4" data points are scattered.
* **2 bit / param (Red dashed line):** This line represents a scaling where each parameter contributes 2 bits of knowledge. It starts at approximately 2 * 10^6 at 10^6 parameters and rises to approximately 10^8 at 5 * 10^7 parameters.
* **1 bit / param (Black solid line):** This line represents a scaling where each parameter contributes 1 bit of knowledge. It starts at approximately 10^6 at 10^6 parameters and rises to approximately 2 * 10^7 at 2 * 10^7 parameters.
### Key Observations
* The bits of knowledge generally increase with the number of parameters for each model size.
* Larger models (# 500k) achieve higher bits of knowledge compared to smaller models (# 20k).
* The "2 bit / param" line provides an upper bound, while the "1 bit / param" line provides a lower bound for the observed scaling.
* The scaling of the #500k model approaches the "2 bit / param" line at higher parameter counts.
### Interpretation
The chart illustrates the scaling relationship between model size (number of parameters) and the amount of knowledge a model can represent (bits of knowledge). The data suggests that increasing the number of parameters generally leads to a higher capacity for knowledge representation. The reference lines ("1 bit / param" and "2 bit / param") provide a benchmark for evaluating the efficiency of knowledge encoding. The #500k model appears to scale more efficiently, approaching the "2 bit / param" limit, indicating a better utilization of parameters for knowledge representation. The loop-1 and loop-4 data points are scattered, suggesting that the loop configuration has a less predictable impact on the scaling of knowledge with parameters.