## Scatter Plot: Scaling: Bits of Knowledge vs. Params
### Overview
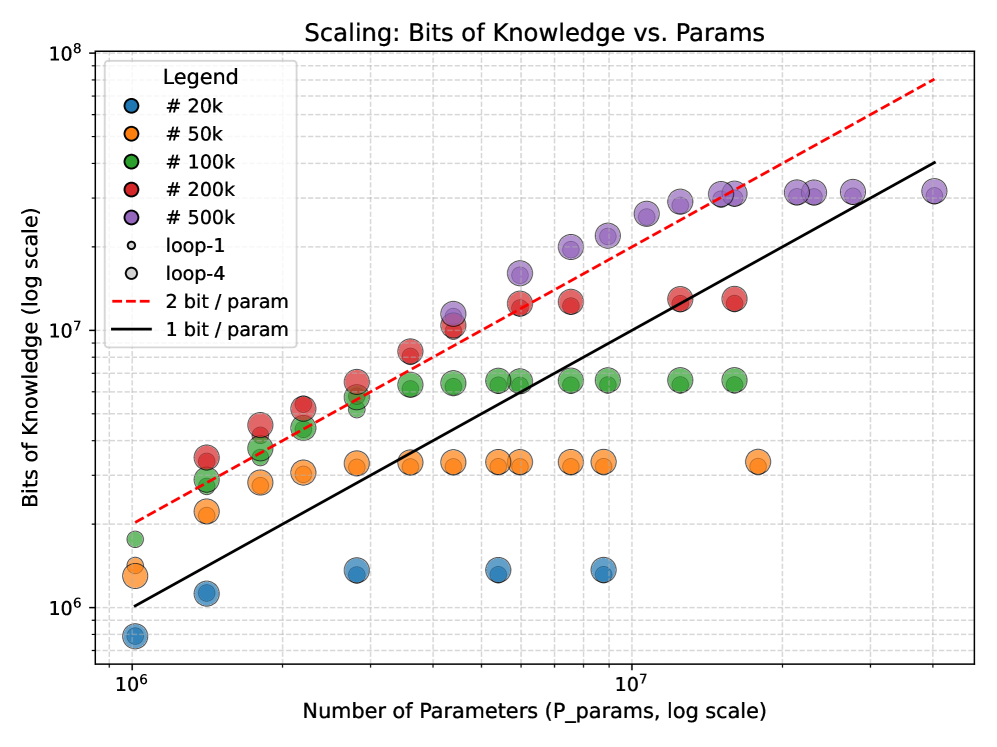
This image presents a scatter plot illustrating the relationship between the number of parameters in a model and the bits of knowledge it contains. The data is presented on a logarithmic scale for both axes. Several data series are plotted, each representing models with a different number of parameters, along with two linear trend lines.
### Components/Axes
* **Title:** Scaling: Bits of Knowledge vs. Params
* **X-axis:** Number of Parameters (P_params, log scale). Scale ranges from approximately 10<sup>6</sup> to 10<sup>7</sup>.
* **Y-axis:** Bits of Knowledge (log scale). Scale ranges from approximately 10<sup>1</sup> to 10<sup>8</sup>.
* **Legend:** Located in the top-left corner. Contains the following entries:
* # 20k (Red)
* # 50k (Orange)
* # 100k (Green)
* # 200k (Purple)
* # 500k (Dark Purple)
* loop-1 (Light Gray)
* loop-4 (Yellow)
* 2 bit / param (Red dashed line)
* 1 bit / param (Black solid line)
### Detailed Analysis
The plot shows several distinct data series, each represented by a different color and size of marker.
* **# 20k (Red):** This series shows a generally upward trend, starting around 10<sup>1</sup> bits of knowledge at 10<sup>6</sup> parameters and reaching approximately 10<sup>6</sup> bits of knowledge at 10<sup>7</sup> parameters. There is significant scatter in the data.
* **# 50k (Orange):** This series also exhibits an upward trend, starting around 10<sup>1</sup> bits of knowledge at 10<sup>6</sup> parameters and reaching approximately 10<sup>6</sup> bits of knowledge at 10<sup>7</sup> parameters. The scatter is less pronounced than the #20k series.
* **# 100k (Green):** This series shows a similar upward trend, starting around 10<sup>2</sup> bits of knowledge at 10<sup>6</sup> parameters and reaching approximately 10<sup>7</sup> bits of knowledge at 10<sup>7</sup> parameters.
* **# 200k (Purple):** This series shows an upward trend, starting around 10<sup>3</sup> bits of knowledge at 10<sup>6</sup> parameters and reaching approximately 10<sup>7</sup> bits of knowledge at 10<sup>7</sup> parameters.
* **# 500k (Dark Purple):** This series shows an upward trend, starting around 10<sup>4</sup> bits of knowledge at 10<sup>6</sup> parameters and reaching approximately 10<sup>8</sup> bits of knowledge at 10<sup>7</sup> parameters.
* **loop-1 (Light Gray):** This series shows a relatively flat trend, with bits of knowledge ranging from approximately 10<sup>4</sup> to 10<sup>6</sup> across the parameter range.
* **loop-4 (Yellow):** This series shows an upward trend, starting around 10<sup>3</sup> bits of knowledge at 10<sup>6</sup> parameters and reaching approximately 10<sup>7</sup> bits of knowledge at 10<sup>7</sup> parameters.
Two linear trend lines are also plotted:
* **2 bit / param (Red dashed line):** This line has a steeper slope and represents a theoretical upper bound on the relationship between parameters and knowledge.
* **1 bit / param (Black solid line):** This line has a shallower slope and represents a theoretical lower bound on the relationship between parameters and knowledge.
### Key Observations
* The data series generally follow an upward trend, indicating that increasing the number of parameters tends to increase the bits of knowledge.
* There is significant scatter within each data series, suggesting that the relationship between parameters and knowledge is not perfectly linear.
* The #500k series consistently shows the highest bits of knowledge for a given number of parameters.
* The loop-1 series shows the lowest bits of knowledge for a given number of parameters.
* The data points generally fall between the 1 bit/param and 2 bit/param lines, suggesting that the models are achieving a reasonable level of knowledge efficiency.
### Interpretation
The plot suggests that there is a logarithmic relationship between the number of parameters in a model and the amount of knowledge it can store. The data indicates that increasing the number of parameters generally leads to an increase in knowledge, but with diminishing returns. The scatter in the data suggests that other factors, such as model architecture and training data, also play a significant role in determining the amount of knowledge a model can acquire. The trend lines provide a theoretical framework for understanding the relationship between parameters and knowledge, and the data points falling between these lines suggest that the models are operating within a reasonable range of efficiency. The difference in performance between the different parameter sizes (#20k, #50k, etc.) highlights the importance of model capacity in achieving higher levels of knowledge. The relatively flat trend of the loop-1 series suggests that this model may be less efficient at utilizing its parameters to store knowledge.