## Diagram: Feynman Diagram Transformation
### Overview
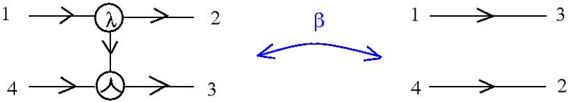
The image presents a diagram illustrating a transformation between two Feynman diagrams. The left diagram shows particles 1 and 4 interacting via intermediate particles represented by circles containing symbols lambda and lambda-bar, resulting in particles 2 and 3. The right diagram shows particles 1 and 4 directly becoming particles 3 and 2. The transformation between these two diagrams is indicated by a blue curved arrow labeled with the Greek letter beta.
### Components/Axes
* **Particles:** Labeled 1, 2, 3, and 4.
* **Interaction Vertices:** Two circular vertices, one containing "λ" (lambda) and the other containing "λ̄" (lambda-bar).
* **Arrows:** Indicate the direction of particle flow.
* **Transformation Arrow:** A blue curved arrow labeled "β" (beta) indicating the transformation between the two diagrams.
### Detailed Analysis
**Left Diagram:**
* Particle 1 enters from the left and interacts at the top vertex (λ).
* Particle 4 enters from the left and interacts at the bottom vertex (λ̄).
* An internal line connects the two vertices, with an arrow pointing downwards.
* Particle 2 exits from the right of the top vertex.
* Particle 3 exits from the right of the bottom vertex.
**Right Diagram:**
* Particle 1 enters from the left and becomes particle 3 on the right.
* Particle 4 enters from the left and becomes particle 2 on the right.
**Transformation:**
* A blue curved arrow labeled "β" connects the two diagrams, indicating a transformation or equivalence between them. The arrow is bidirectional, suggesting the transformation can occur in either direction.
### Key Observations
* The diagram illustrates a relationship between two different representations of a particle interaction.
* The blue arrow labeled beta indicates a transformation between the two diagrams.
* The left diagram shows an interaction mediated by intermediate particles, while the right diagram shows a direct interaction.
### Interpretation
The diagram likely represents a mathematical or physical equivalence between two different ways of calculating the same process in quantum field theory. The left diagram represents a higher-order process involving intermediate particles, while the right diagram represents a lower-order, direct interaction. The transformation indicated by "β" suggests that the higher-order process can be approximated or related to the lower-order process under certain conditions. This could be related to concepts like effective field theories or renormalization group flows, where complex interactions are simplified to their essential components at a particular energy scale.