\n
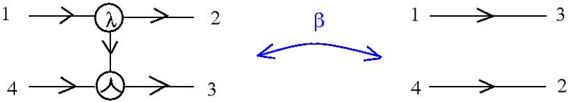
## Diagram: Causal Network Representation
### Overview
The image depicts two causal network diagrams. The diagram on the left shows a more complex network with two decision nodes, while the diagram on the right shows a simpler network with direct causal links. Both diagrams use arrows to indicate the direction of causal influence.
### Components/Axes
The diagrams consist of nodes (circles or points) representing variables and arrows representing causal relationships. The left diagram includes labels "λ" and "β" associated with the decision nodes. The nodes are numbered 1 through 4.
### Detailed Analysis or Content Details
**Left Diagram:**
* **Node 1:** Has a directed arrow pointing *into* the top decision node (labeled "λ").
* **Node 2:** Has a directed arrow pointing *out* of the top decision node (labeled "λ").
* **Node 3:** Has a directed arrow pointing *out* of the bottom decision node.
* **Node 4:** Has a directed arrow pointing *into* the bottom decision node.
* **Decision Node (Top):** Labeled "λ". Receives input from Node 1 and has an output to Node 2.
* **Decision Node (Bottom):** Receives input from Node 4 and has an output to Node 3.
* The two decision nodes are connected by a downward arrow, indicating a causal relationship.
**Right Diagram:**
* **Node 1:** Has a directed arrow pointing to Node 3.
* **Node 4:** Has a directed arrow pointing to Node 2.
* **Bidirectional Arrow:** A blue, double-headed arrow labeled "β" connects Node 1 and Node 4. This indicates a reciprocal causal relationship between these two nodes.
### Key Observations
The left diagram represents a more complex causal structure with two decision points and a connection between them. The right diagram shows a simpler structure with direct causal links and a bidirectional relationship between nodes 1 and 4. The use of "λ" and "β" suggests these are parameters or variables within the causal models.
### Interpretation
The diagrams illustrate causal relationships between variables. The left diagram suggests that Node 1 and Node 4 influence Nodes 2 and 3 respectively, through decision nodes labeled "λ" and an unspecified node. The connection between the decision nodes implies a dependency or interaction between the two processes. The right diagram shows a simpler system where Node 1 influences Node 3 and Node 4 influences Node 2, with a reciprocal influence between Node 1 and Node 4 represented by "β".
These diagrams are likely used to model a system where variables influence each other, and the arrows represent the direction of causality. The labels "λ" and "β" could represent parameters or variables that quantify the strength or nature of these causal relationships. The diagrams could be part of a larger causal model used for prediction, intervention, or understanding the underlying mechanisms of a system. The diagrams do not provide any numerical data, but rather a qualitative representation of causal relationships.