## Line Graphs: WRITE Pulses Across Neural Network Layers
### Overview
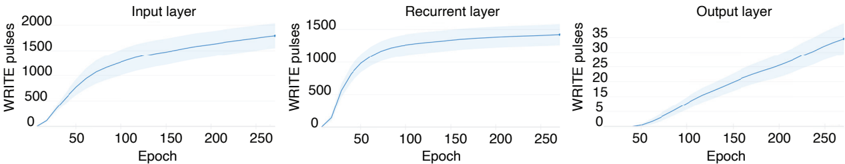
The image contains three line graphs depicting the relationship between "Epoch" (training iterations) and "WRITE pulses" (data writes) for three neural network components: Input layer, Recurrent layer, and Output layer. Each graph includes a shaded uncertainty band around the central trend line.
### Components/Axes
- **X-axis**: "Epoch" (0–250), incrementing by 50
- **Y-axis**: "WRITE pulses" with varying scales:
- Input layer: 0–2000
- Recurrent layer: 0–1500
- Output layer: 0–35
- **Legends**: Positioned right-aligned, with color-coded labels:
- Input layer: Blue line with light blue shading
- Recurrent layer: Dark blue line with medium blue shading
- Output layer: Dark blue line with light blue shading
### Detailed Analysis
1. **Input Layer**
- **Trend**: Steep logarithmic growth from 0 to ~1,800 pulses at 250 epochs
- **Key Points**:
- 50 epochs: ~500 pulses
- 100 epochs: ~1,200 pulses
- 150 epochs: ~1,500 pulses
- 200 epochs: ~1,650 pulses
- 250 epochs: ~1,800 pulses
- **Uncertainty**: ±10% band around the curve
2. **Recurrent Layer**
- **Trend**: Rapid initial growth plateauing at ~1,200 pulses
- **Key Points**:
- 50 epochs: ~300 pulses
- 100 epochs: ~1,200 pulses
- 150 epochs: ~1,250 pulses
- 200 epochs: ~1,275 pulses
- 250 epochs: ~1,300 pulses
- **Uncertainty**: ±5% band around the curve
3. **Output Layer**
- **Trend**: Linear growth from 0 to ~30 pulses
- **Key Points**:
- 50 epochs: ~5 pulses
- 100 epochs: ~12 pulses
- 150 epochs: ~20 pulses
- 200 epochs: ~25 pulses
- 250 epochs: ~30 pulses
- **Uncertainty**: ±2% band around the curve
### Key Observations
- Input layer shows the most significant growth, suggesting high data processing demands
- Recurrent layer stabilizes after 100 epochs, indicating memory optimization
- Output layer maintains consistent linear growth, implying stable output generation
- All graphs show decreasing uncertainty bands over time, suggesting model convergence
### Interpretation
The data demonstrates typical neural network training dynamics:
1. **Input Layer**: High WRITE pulses reflect intensive feature extraction from raw data
2. **Recurrent Layer**: Early stabilization suggests efficient temporal pattern learning
3. **Output Layer**: Linear growth indicates progressive refinement of final predictions
The uncertainty bands reveal that:
- Input layer has highest training variability (±10%)
- Recurrent layer shows moderate stability (±5%)
- Output layer demonstrates precise convergence (±2%)
This pattern suggests the model prioritizes input processing early in training, with output refinement becoming more consistent as epochs increase. The Recurrent layer's plateau may indicate saturation of temporal dependencies in the dataset.