# Technical Document Extraction: Roofline Model (Llama 33B, A6000)
## 1. Header Information
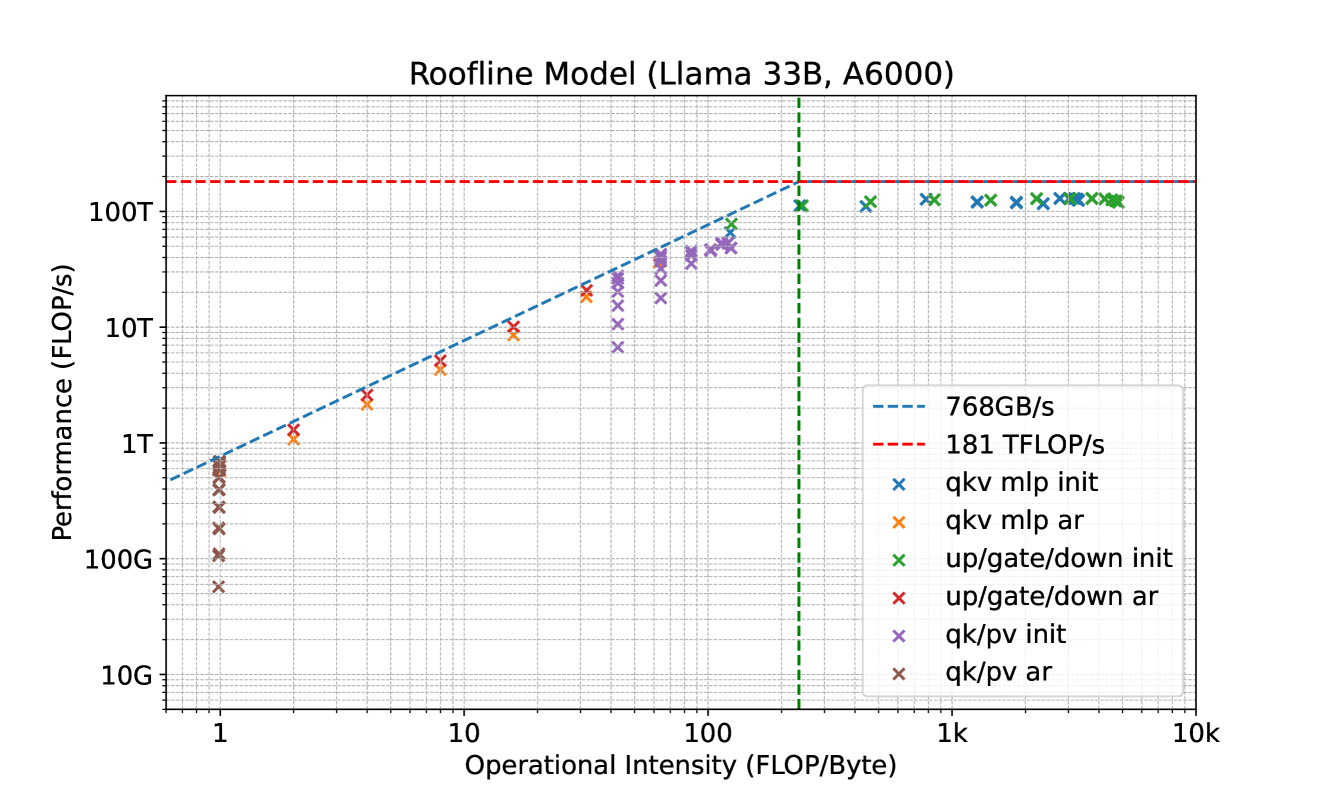
* **Title:** Roofline Model (Llama 33B, A6000)
* **Subject:** Performance analysis of a Llama 33B model running on an NVIDIA A6000 GPU.
## 2. Chart Specifications
The image is a **Roofline Chart**, a log-log plot used to visualize the performance limits of a computing system based on operational intensity.
### Axis Definitions
* **X-Axis (Horizontal):** Operational Intensity (FLOP/Byte)
* **Scale:** Logarithmic, ranging from approximately 0.6 to 10k.
* **Major Markers:** 1, 10, 100, 1k, 10k.
* **Y-Axis (Vertical):** Performance (FLOP/s)
* **Scale:** Logarithmic, ranging from 10G to roughly 500T.
* **Major Markers:** 10G, 100G, 1T, 10T, 100T.
### Legend and Thresholds
The legend is located in the bottom-right quadrant of the plot area.
| Label | Color/Style | Type | Value/Description |
| :--- | :--- | :--- | :--- |
| **768GB/s** | Blue Dashed Line | Slope | Memory Bandwidth Limit |
| **181 TFLOP/s** | Red Dashed Line | Horizontal | Peak Compute Performance |
| **qkv mlp init** | Blue 'x' | Data Series | Query/Key/Value MLP Initialization |
| **qkv mlp ar** | Orange 'x' | Data Series | Query/Key/Value MLP Auto-Regressive |
| **up/gate/down init** | Green 'x' | Data Series | Up/Gate/Down Projection Initialization |
| **up/gate/down ar** | Red 'x' | Data Series | Up/Gate/Down Projection Auto-Regressive |
| **qk/pv init** | Purple 'x' | Data Series | QK/PV Initialization |
| **qk/pv ar** | Brown 'x' | Data Series | QK/PV Auto-Regressive |
## 3. Component Analysis and Trends
### The "Roofline" Boundary
* **Memory-Bound Region:** Represented by the blue dashed diagonal line. It shows that for low operational intensity, performance is limited by the 768GB/s bandwidth.
* **Compute-Bound Region:** Represented by the red dashed horizontal line at 181 TFLOP/s. It shows the maximum theoretical throughput regardless of increased operational intensity.
* **Ridge Point:** The intersection occurs at an operational intensity of approximately **235 FLOP/Byte** (indicated by a vertical green dashed line).
### Data Series Trends
1. **Initialization (init) Series (Blue, Green, Purple):**
* **Trend:** These points cluster at the high end of the X-axis (Operational Intensity > 100).
* **Observation:** Most "init" tasks are compute-bound, sitting very close to the 181 TFLOP/s red line. The "up/gate/down init" (Green) and "qkv mlp init" (Blue) achieve the highest performance, nearly saturating the GPU's compute capacity.
2. **Auto-Regressive (ar) Series (Orange, Red, Brown):**
* **Trend:** These points slope upward from left to right, following the blue dashed diagonal line.
* **Observation:** These tasks are memory-bound. As the operational intensity increases (moving right), the performance increases linearly on the log-log scale until it hits the compute ceiling.
3. **qk/pv ar (Brown):**
* **Trend:** Vertical column at Operational Intensity = 1.
* **Observation:** This is the most memory-constrained task, showing a wide range of performance (from ~60G to ~800G FLOP/s) at a very low operational intensity.
## 4. Data Point Extraction (Approximate Values)
| Category | Operational Intensity (FLOP/Byte) | Performance (FLOP/s) | Regime |
| :--- | :--- | :--- | :--- |
| **up/gate/down init** | ~250 to ~5,000 | ~120T to ~150T | Compute-Bound |
| **qkv mlp init** | ~400 to ~4,000 | ~120T to ~140T | Compute-Bound |
| **qk/pv init** | ~40 to ~150 | ~7T to ~80T | Transition/Compute |
| **up/gate/down ar** | ~1 to ~40 | ~600G to ~20T | Memory-Bound |
| **qkv mlp ar** | ~2 to ~40 | ~1T to ~20T | Memory-Bound |
| **qk/pv ar** | ~1 | ~60G to ~800G | Memory-Bound |
## 5. Summary of Findings
The Llama 33B model on an A6000 GPU exhibits a clear distinction between initialization and auto-regressive phases. **Initialization** phases for large weight matrices (MLP and Up/Gate/Down) are highly efficient and **compute-bound**, operating near the 181 TFLOP/s limit. Conversely, **Auto-Regressive** phases are strictly **memory-bound**, with performance dictated by the 768 GB/s bandwidth limit, particularly for the QK/PV operations which reside at the lowest operational intensity.