# Technical Document Extraction: Roofline Model (Llama 33B, A6000)
## Chart Overview
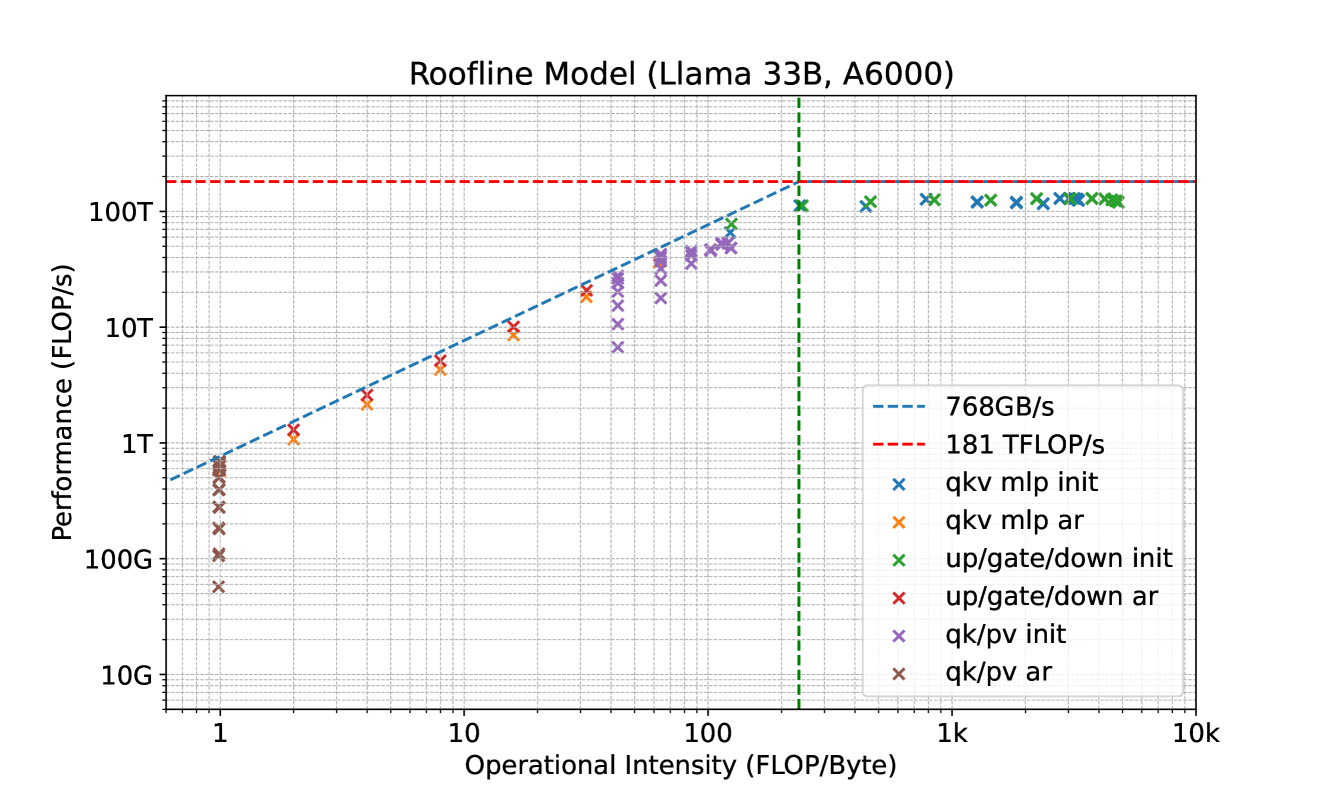
- **Title**: Roofline Model (Llama 33B, A6000)
- **Type**: Scatter plot with trend lines
- **Purpose**: Visualizes computational performance vs. operational intensity for various operations on Llama 33B using A6000 GPU.
---
## Axis Labels and Ranges
- **X-axis (Operational Intensity)**:
- Units: FLOP/Byte
- Range: 1 to 10,000 (logarithmic scale)
- Key markers:
- Vertical green dashed line at 100 FLOP/Byte
- **Y-axis (Performance)**:
- Units: FLOP/s
- Range: 10G (10⁷) to 100T (10¹⁴)
- Key markers:
- Horizontal red dashed line at 181 TFLOP/s (1.81×10¹³)
- Horizontal blue dashed line at 768GB/s (7.68×10⁸)
---
## Legend and Data Series
| Color | Marker | Label | Description |
|-------|--------|------------------------|--------------------------------------|
| Blue | X | qkv mlp init | Query-Key-Value Matrix Multiplication Initialization |
| Orange| X | qkv mlp ar | Query-Key-Value Matrix Multiplication Activation |
| Green | X | up/gate/down init | Up/Down Gate Initialization |
| Red | X | up/gate/down ar | Up/Down Gate Activation |
| Purple| X | qk/pv init | Query-Key/Pair Value Initialization |
| Brown | X | qk/pv ar | Query-Key/Pair Value Activation |
---
## Key Trends and Observations
1. **Performance Scaling**:
- Performance increases exponentially with operational intensity (log-log scale).
- Blue dashed line (768GB/s) represents memory bandwidth ceiling.
- Red dashed line (181 TFLOP/s) represents peak FLOP performance ceiling.
2. **Data Point Distribution**:
- **qkv mlp init/ar**:
- Initialization (blue) and activation (orange) points cluster below the 100 TFLOP/s line.
- Activation points show higher performance than initialization.
- **up/gate/down init/ar**:
- Green (init) and red (ar) points cluster near the 100 TFLOP/s ceiling.
- **qk/pv init/ar**:
- Purple (init) and brown (ar) points show lower performance, concentrated below 10T FLOP/s.
3. **Critical Thresholds**:
- **100 FLOP/Byte (green line)**: Separates memory-bound (left) vs. compute-bound (right) operations.
- **181 TFLOP/s (red line)**: Maximum achievable performance for compute-bound operations.
- **768GB/s (blue line)**: Memory bandwidth limit for data movement.
4. **Performance Bottlenecks**:
- Operations crossing the red line (181 TFLOP/s) are compute-bound.
- Operations below the red line but above the blue line are memory-bound.
- Operations below both lines are limited by both compute and memory.
---
## Technical Implications
- **Optimization Opportunities**:
- Operations near the red line (e.g., up/gate/down ar) are near peak performance.
- qk/pv operations (purple/brown) show significant room for optimization.
- **Hardware Constraints**:
- Memory bandwidth (768GB/s) limits data-intensive operations.
- FLOP ceiling (181 TFLOP/s) caps compute-bound performance.
---
## Data Point Density
- Highest density of points in the 10–100 TFLOP/s range (y-axis) and 10–1000 FLOP/Byte range (x-axis).
- Sparse data points above 100 TFLOP/s, indicating few operations reach peak performance.
---
## Conclusion
The chart demonstrates the trade-offs between computational intensity and memory bandwidth for Llama 33B operations on A6000. Key insights include:
1. Most operations are memory-bound (below 100 FLOP/Byte).
2. Up/gate/down activation (red) approaches the FLOP ceiling.
3. Query-Key/Pair Value operations (purple/brown) are the most memory-bound.