## Diagram: State Transition Diagram
### Overview
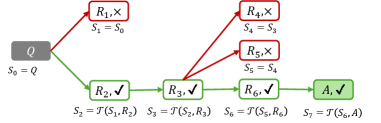
The image is a state transition diagram illustrating a process that starts with an initial state `Q` and transitions through a series of states based on rules `R`. The diagram shows both successful (green) and unsuccessful (red) transitions, indicated by checkmarks and crosses, respectively.
### Components/Axes
* **Nodes:** Represent states in the process.
* `Q`: Initial state, represented by a gray rounded rectangle. `S0 = Q`
* `R1`: State, represented by a red rounded rectangle with a cross. `S1 = S0`
* `R2`: State, represented by a green rounded rectangle with a checkmark. `S2 = T(S1, R2)`
* `R3`: State, represented by a green rounded rectangle with a checkmark. `S3 = T(S2, R3)`
* `R4`: State, represented by a red rounded rectangle with a cross. `S4 = S3`
* `R5`: State, represented by a red rounded rectangle with a cross. `S5 = S4`
* `R6`: State, represented by a green rounded rectangle with a checkmark. `S6 = T(S5, R6)`
* `A`: State, represented by a green rounded rectangle with a checkmark. `S7 = T(S6, A)`
* **Edges:** Represent transitions between states.
* Green edges indicate successful transitions.
* Red edges indicate unsuccessful transitions.
* **Labels:**
* `Q`: Initial state.
* `R1, R2, R3, R4, R5, R6`: Rules or conditions for transitions.
* `A`: Final state.
* `S0, S1, S2, S3, S4, S5, S6, S7`: State variables.
* `T(x, y)`: A function that determines the next state based on the current state and a rule.
### Detailed Analysis
* The process starts at state `Q` where `S0 = Q`.
* From `Q`, there are two possible transitions:
* A red arrow leads to `R1` where `S1 = S0`. This transition is marked with a cross, indicating failure.
* A green arrow leads to `R2` where `S2 = T(S1, R2)`. This transition is marked with a checkmark, indicating success.
* From `R2`, a green arrow leads to `R3` where `S3 = T(S2, R3)`. This transition is marked with a checkmark, indicating success.
* From `R3`, there are two possible transitions:
* A red arrow leads to `R4` where `S4 = S3`. This transition is marked with a cross, indicating failure.
* A red arrow leads to `R5` where `S5 = S4`. This transition is marked with a cross, indicating failure.
* From `R3`, a green arrow leads to `R6` where `S6 = T(S5, R6)`. This transition is marked with a checkmark, indicating success.
* From `R6`, a green arrow leads to `A` where `S7 = T(S6, A)`. This transition is marked with a checkmark, indicating success.
### Key Observations
* The diagram shows a process that can either succeed or fail at different stages.
* Successful transitions are marked with green arrows and checkmarks, while unsuccessful transitions are marked with red arrows and crosses.
* The state variables `S0` through `S7` represent the state of the process at each stage.
* The function `T(x, y)` determines the next state based on the current state and a rule.
### Interpretation
The state transition diagram illustrates a decision-making process where the system starts in state `Q` and attempts to reach state `A`. The process involves applying rules `R1` through `R6`. Some rules lead to successful transitions (green paths), while others lead to failures (red paths). The diagram highlights the possible paths the system can take and the conditions that determine the outcome of each transition. The function `T(x, y)` represents the logic that governs how the system transitions from one state to another based on the applied rule. The diagram could represent an algorithm, a decision tree, or any process that involves a series of steps with potential success or failure at each step.