## Flowchart: Process Transition Diagram
### Overview
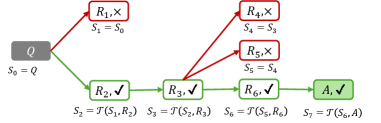
The image depicts a flowchart illustrating a sequential process with decision points, transitions, and outcomes. It includes nodes labeled with identifiers (e.g., Q, R1, R2, etc.), arrows representing transitions, and success/failure indicators (✓ for success, × for failure). The diagram uses color coding (red for failure, green for success) and includes mathematical expressions for state transitions.
### Components/Axes
- **Nodes**:
- **Q**: Starting point (S₀ = Q).
- **R1, R2, R3, R4, R5, R6**: Intermediate nodes with transitions.
- **A**: Final node (acceptance state).
- **Arrows**:
- **Red arrows**: Indicate failed transitions (×).
- **Green arrows**: Indicate successful transitions (✓).
- **Conditions**:
- State transitions are defined by equations (e.g., S₁ = S₀, S₂ = T(S₁, R₂)).
- **Legend**:
- Red: Failure (×).
- Green: Success (✓).
### Detailed Analysis
1. **Starting Node (Q)**:
- Initial state: S₀ = Q.
- Two outgoing arrows:
- **Red arrow to R1**: Condition S₁ = S₀ (failure).
- **Green arrow to R2**: Condition S₂ = T(S₁, R₂) (success).
2. **Intermediate Nodes**:
- **R2**:
- Green arrow to R3: S₃ = T(S₂, R₃) (success).
- **R3**:
- Green arrow to R6: S₆ = T(S₅, R₆) (success).
- Red arrows to R4 and R5:
- S₄ = S₃ (failure).
- S₅ = S₄ (failure).
- **R6**:
- Green arrow to A: S₇ = T(S₆, A) (success).
3. **Final Node (A)**:
- Acceptance state (✓).
### Key Observations
- **Success Path**: Q → R2 → R3 → R6 → A (all transitions marked ✓).
- **Failure Paths**:
- Q → R1 (failure).
- R3 → R4 and R3 → R5 (both failures).
- **State Transitions**:
- The function T appears to map states based on node interactions (e.g., S₂ = T(S₁, R₂)).
- **Color Consistency**:
- Red arrows (failure) and green arrows (success) align with the legend.
### Interpretation
The diagram represents a decision-making or validation process where transitions between states depend on specific conditions. Successful paths (green) lead to the final acceptance state (A), while failed transitions (red) halt progress. The use of mathematical expressions (e.g., Sₖ = T(Sₖ₋₁, Rₖ)) suggests a formalized system, possibly for algorithmic validation or workflow automation. The presence of multiple failure points (R1, R4, R5) highlights potential bottlenecks or error conditions in the process. The final state A is only reachable via a strictly successful path, emphasizing the importance of adhering to transition rules.