\n
## Histogram: Distribution of Thinking Tokens
### Overview
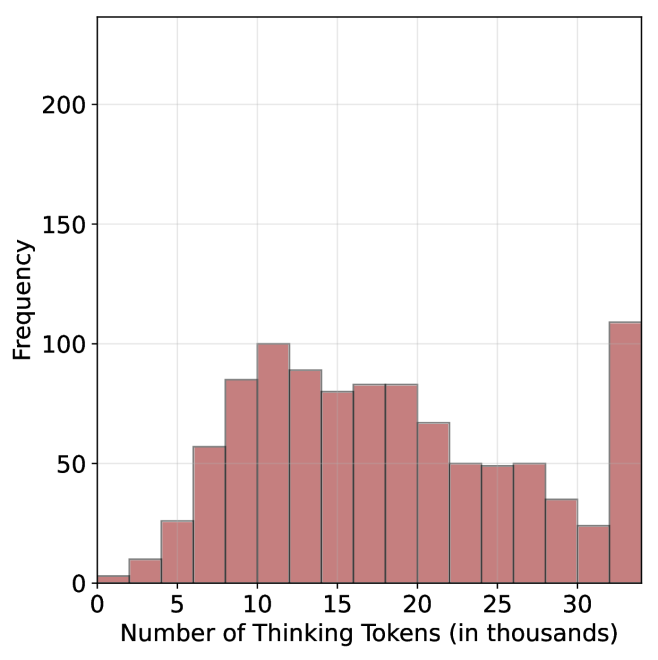
The image presents a histogram visualizing the frequency distribution of "Thinking Tokens". The x-axis represents the number of thinking tokens (in thousands), and the y-axis represents the frequency. The data appears to be binned into intervals of approximately 5,000 tokens.
### Components/Axes
* **X-axis Title:** "Number of Thinking Tokens (in thousands)"
* Scale: 0 to 35 (in thousands)
* Markers: 0, 5, 10, 15, 20, 25, 30, 35
* **Y-axis Title:** "Frequency"
* Scale: 0 to 200
* Markers: 0, 50, 100, 150, 200
* **Histogram Bars:** Filled with a light reddish-brown color.
### Detailed Analysis
The histogram shows a roughly bimodal distribution. The data can be described as follows (approximating values from the visual representation):
* **Bin 0-5:** Frequency ≈ 15
* **Bin 5-10:** Frequency ≈ 80
* **Bin 10-15:** Frequency ≈ 95
* **Bin 15-20:** Frequency ≈ 85
* **Bin 20-25:** Frequency ≈ 60
* **Bin 25-30:** Frequency ≈ 50
* **Bin 30-35:** Frequency ≈ 100
The distribution peaks around 10-15 thousand tokens and again around 30-35 thousand tokens. There is a noticeable dip in frequency between 20 and 25 thousand tokens.
### Key Observations
* The distribution is not symmetrical.
* There are two primary peaks, suggesting two common ranges for the number of thinking tokens.
* The frequency is relatively low for very small and very large numbers of thinking tokens.
* The data is discrete, represented by bins.
### Interpretation
The histogram suggests that the number of "Thinking Tokens" is not uniformly distributed. The presence of two peaks indicates that there are two distinct groups or processes that generate different quantities of these tokens. The lower peak around 10-15 thousand tokens might represent a typical or baseline level of thinking activity, while the higher peak around 30-35 thousand tokens could represent more intensive or complex thought processes. The dip in the middle suggests that values in the 20-25 thousand range are less common.
Without further context, it's difficult to determine the exact meaning of "Thinking Tokens." However, the data suggests that this metric is useful for differentiating between different levels or types of cognitive activity. The bimodal distribution could be indicative of different user groups, different tasks, or different stages of a cognitive process. Further investigation would be needed to understand the underlying reasons for this distribution.