## Bar Chart: Frequency Distribution of Thinking Tokens
### Overview
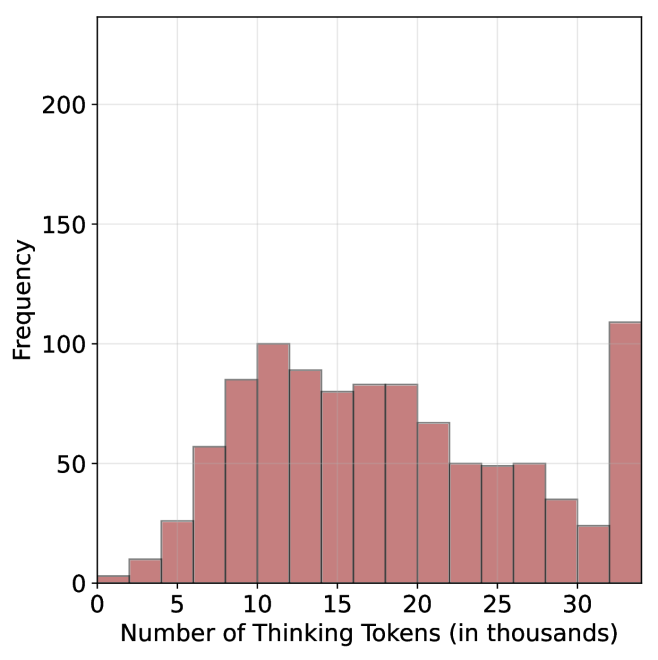
The image displays a bar chart visualizing the frequency distribution of "Number of Thinking Tokens (in thousands)" across discrete intervals. The chart uses vertical bars in a reddish-brown color to represent frequency counts on the y-axis. No title or legend is visible in the image.
### Components/Axes
- **X-axis**: Labeled "Number of Thinking Tokens (in thousands)" with tick marks at intervals of 5 (0, 5, 10, 15, 20, 25, 30).
- **Y-axis**: Labeled "Frequency" with tick marks at intervals of 50 (0, 50, 100, 150, 200).
- **Bars**: Seven vertical bars correspond to the x-axis intervals. Colors are uniform (reddish-brown) with no legend to differentiate categories.
### Detailed Analysis
1. **0–5k Tokens**: Frequency ≈ 5 (lowest bar, barely visible above baseline).
2. **5–10k Tokens**: Frequency ≈ 25 (moderate increase).
3. **10–15k Tokens**: Frequency ≈ 100 (peak frequency).
4. **15–20k Tokens**: Frequency ≈ 80 (slight decline from peak).
5. **20–25k Tokens**: Frequency ≈ 70 (gradual decrease).
6. **25–30k Tokens**: Frequency ≈ 50 (further decline).
7. **30–35k Tokens**: Frequency ≈ 110 (second-highest frequency, outlier compared to adjacent intervals).
### Key Observations
- The highest frequency occurs in the **30–35k token range** (≈110), which is an outlier relative to the gradual decline observed in earlier intervals.
- The **10–15k token range** (≈100) is the second-highest frequency, suggesting a concentration of data in this interval.
- Frequencies decrease from 10–15k to 25–30k, then spike again at 30–35k, indicating potential bimodal distribution or external factors influencing the 30–35k range.
### Interpretation
The data suggests that thinking tokens are disproportionately concentrated in two ranges: **10–15k** and **30–35k**. The spike at 30–35k may reflect a specific event, category, or anomaly not represented in other intervals. The absence of a legend or title limits contextual interpretation, but the distribution implies that most tokens cluster around mid-to-high ranges, with a notable outlier at the upper end. Further investigation into the 30–35k range is warranted to understand its disproportionate frequency.