## Line Graph: Evaluation Reward vs. Episode
### Overview
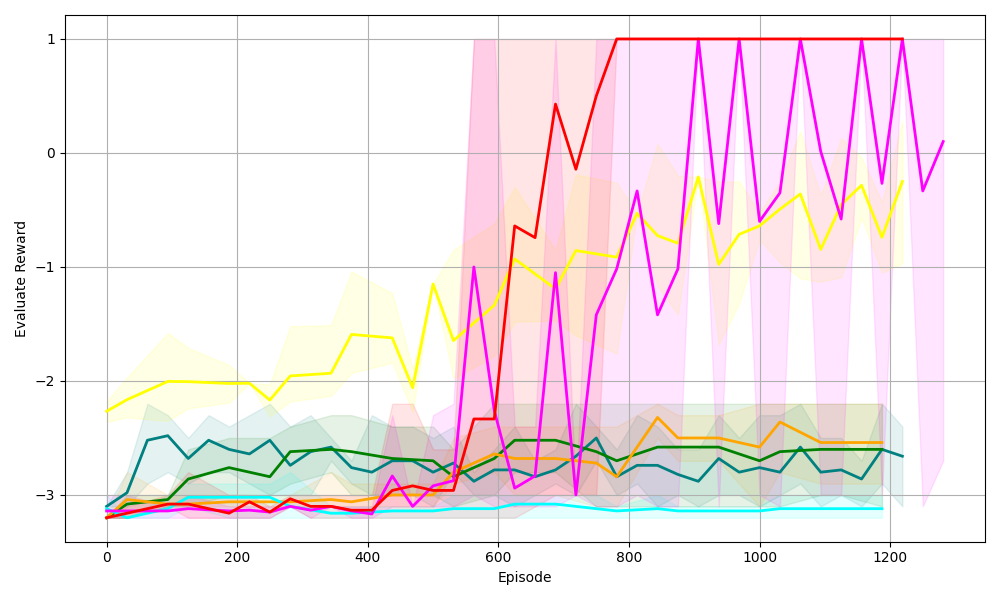
The image depicts a line graph comparing the performance of six reinforcement learning algorithms over 1200 episodes. The y-axis represents "Evaluate Reward" (ranging from -3 to 1), and the x-axis represents "Episode" (0 to 1200). Each algorithm is represented by a colored line with a shaded region indicating variability/confidence intervals.
### Components/Axes
- **X-axis (Episode)**: Labeled "Episode," with ticks at 0, 200, 400, 600, 800, 1000, and 1200.
- **Y-axis (Evaluate Reward)**: Labeled "Evaluate Reward," with ticks at -3, -2, -1, 0, and 1.
- **Legend**: Located on the right, associating colors with algorithms:
- Red: PPO
- Purple: A2C
- Yellow: DQN
- Green: SAC
- Blue: TD3
- Cyan: Random
### Detailed Analysis
1. **PPO (Red Line)**:
- Starts at ~-3 (episode 0).
- Sharp upward trend, reaching ~1 by episode 600.
- Remains flat at 1 until episode 1200.
- Shaded region widest initially, narrowing as performance stabilizes.
2. **A2C (Purple Line)**:
- Starts at ~-3.5 (episode 0).
- Jagged upward trend, peaking at ~1 by episode 800.
- Oscillates between ~0.5 and 1 after episode 800.
- Shaded region indicates high variability early on.
3. **DQN (Yellow Line)**:
- Starts at ~-2.5 (episode 0).
- Gradual upward trend, plateauing near -1 by episode 1200.
- Shaded region shows moderate variability.
4. **SAC (Green Line)**:
- Starts at ~-3 (episode 0).
- Slow upward trend, stabilizing near -2 by episode 1200.
- Shaded region indicates low variability.
5. **TD3 (Blue Line)**:
- Starts at ~-3 (episode 0).
- Fluctuates between -3 and -2, trending upward slightly.
- Shaded region shows moderate variability.
6. **Random (Cyan Line)**:
- Remains flat at ~-3 throughout all episodes.
- No shaded region (constant performance).
### Key Observations
- **PPO and A2C** outperform all other algorithms, achieving the highest rewards (~1).
- **DQN and SAC** show moderate improvement but lag behind PPO/A2C.
- **Random** performs worst, with no learning observed.
- **Shaded regions** suggest PPO and A2C have higher variability in early episodes, stabilizing later.
- Lines cross around episode 600, with PPO overtaking others.
### Interpretation
The data demonstrates that **PPO and A2C** are the most effective algorithms for this task, achieving optimal rewards by ~600 episodes. Their shaded regions indicate initial instability, likely due to exploration/exploitation trade-offs. **DQN and SAC** show gradual learning but fail to match the top performers. The **Random** algorithm’s flat line confirms no meaningful learning occurred. The variability in shaded regions highlights the importance of confidence intervals in evaluating algorithmic performance. PPO’s consistent performance after episode 600 suggests robustness, while A2C’s oscillations may reflect sensitivity to hyperparameters or environment dynamics.