## Grouped Bar Chart: Law School Admissions
### Overview
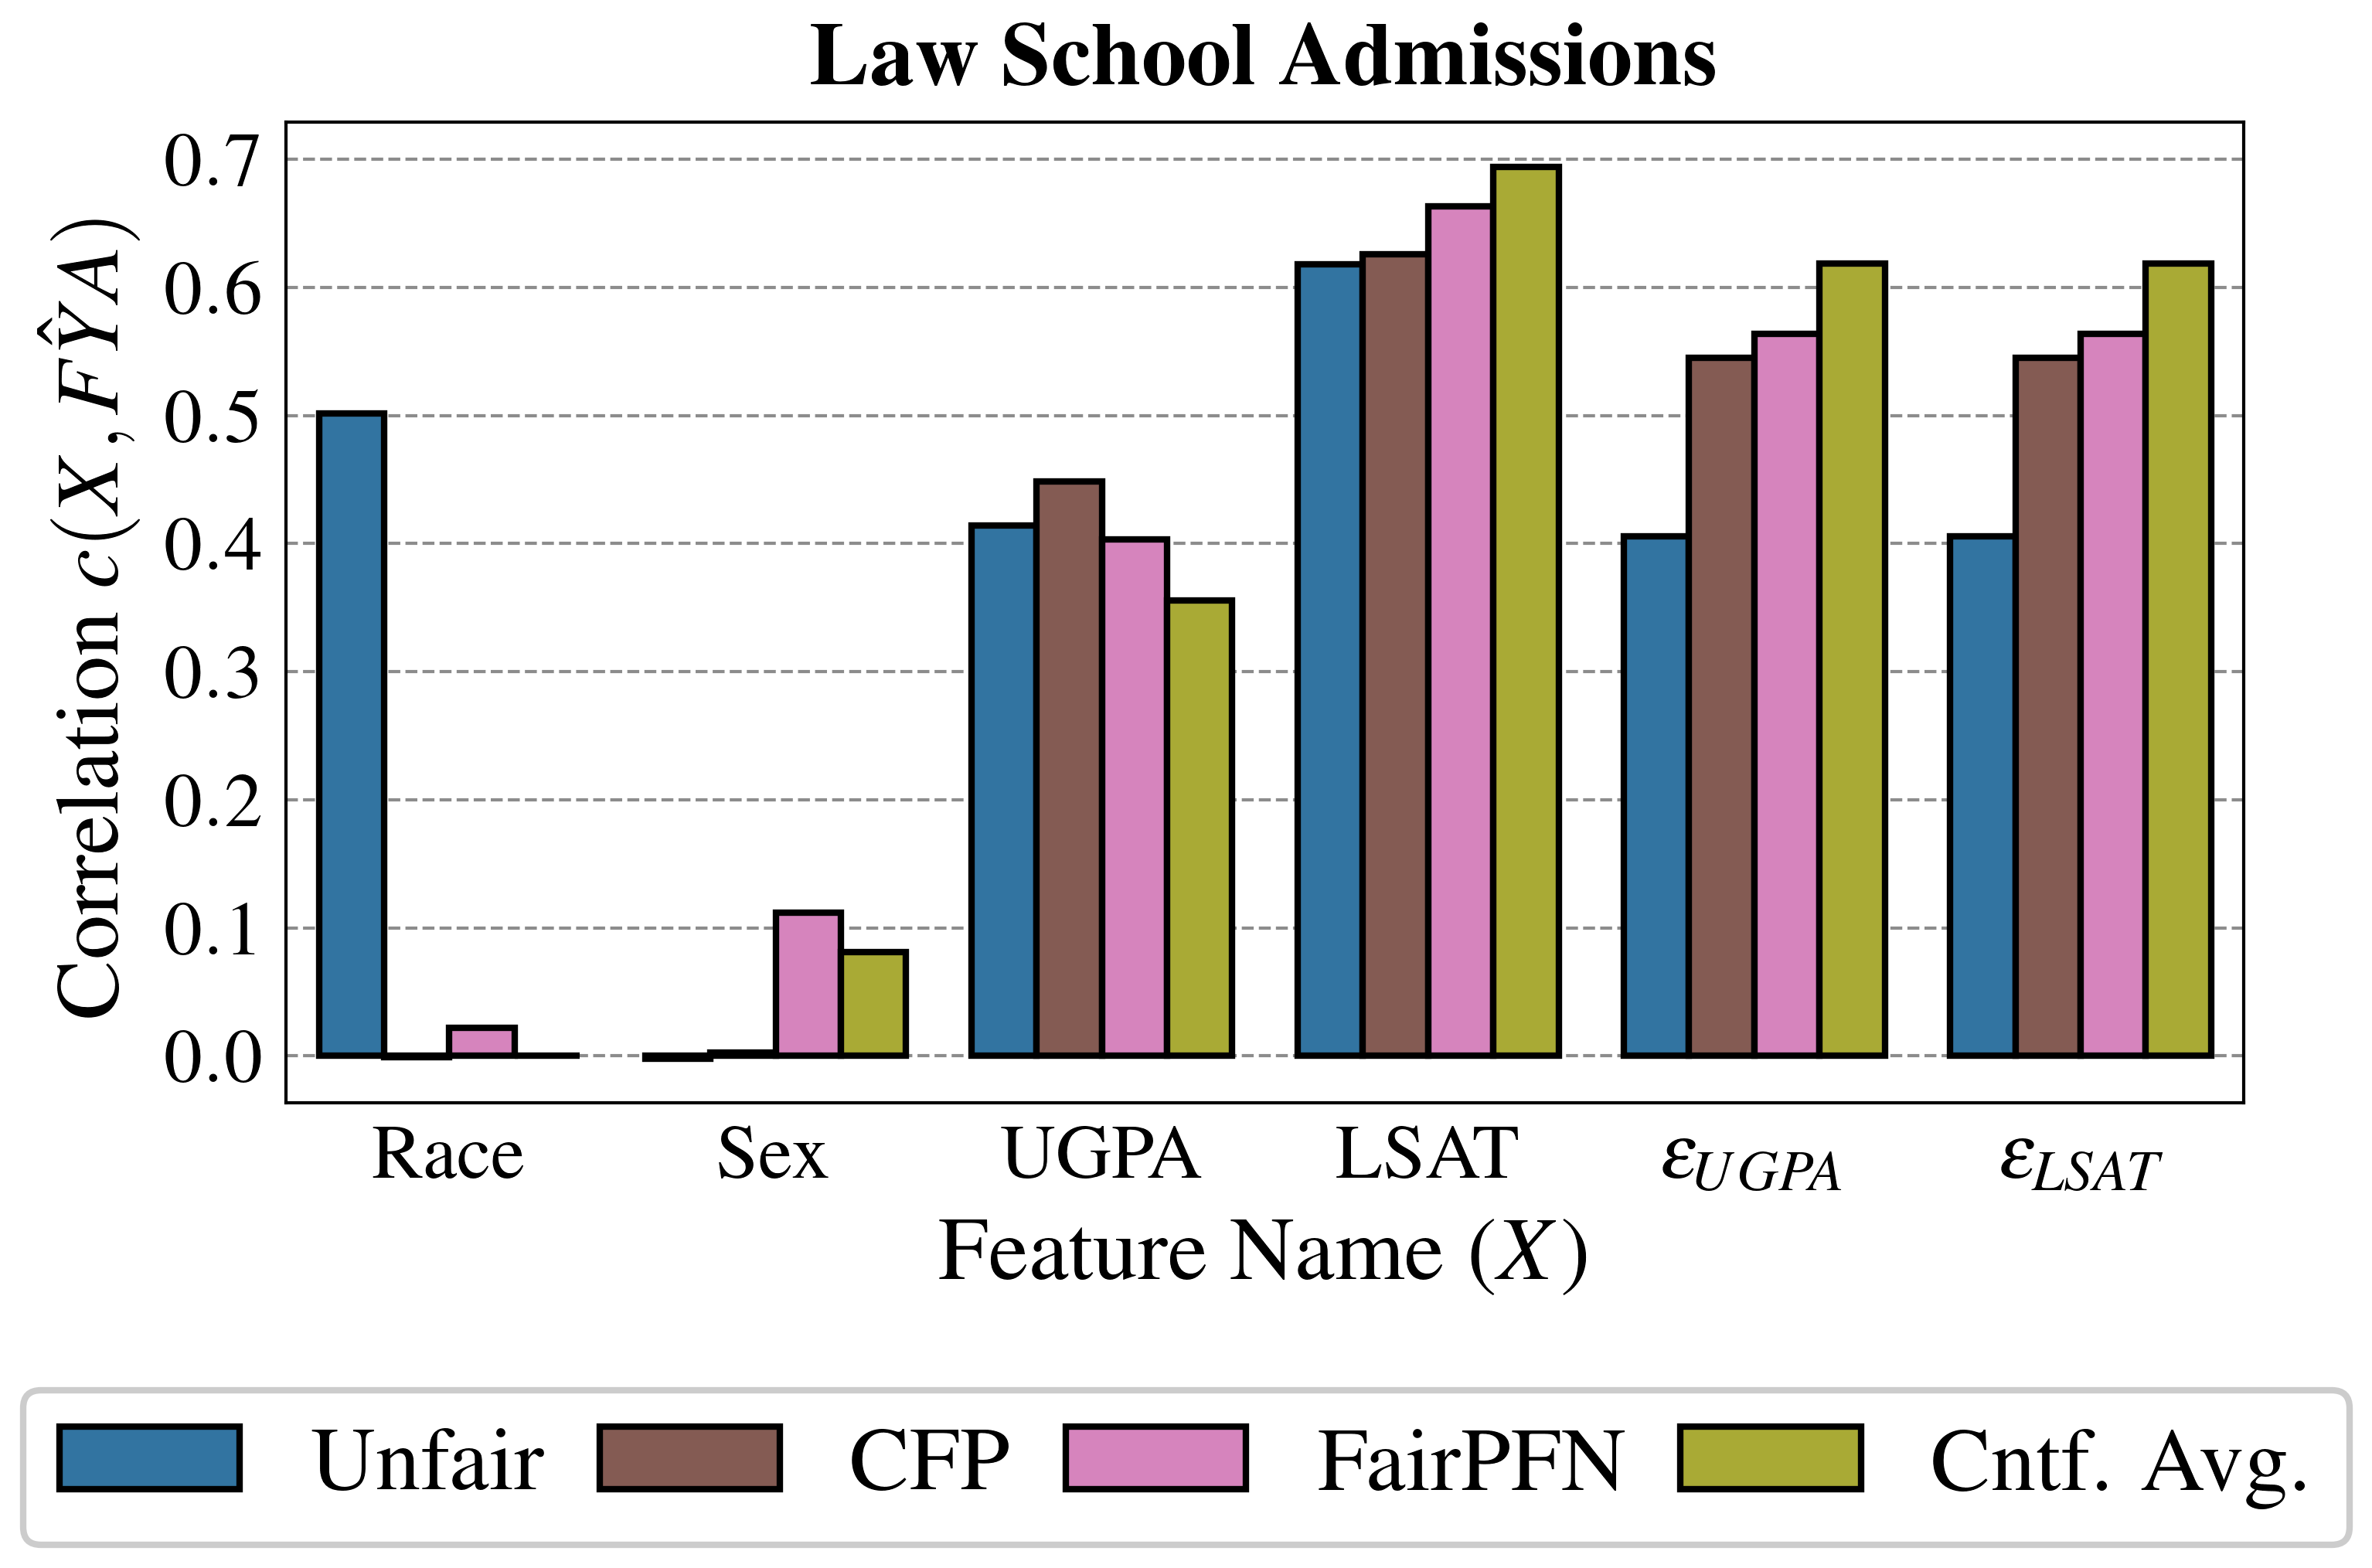
The image displays a grouped bar chart titled "Law School Admissions." It compares the correlation between various input features (X) and a model's output (F̂YA) across four different methods or models. The chart is designed to analyze fairness or bias in a predictive model for law school admissions.
### Components/Axes
* **Title:** "Law School Admissions" (centered at the top).
* **Y-axis:** Labeled "Correlation c(X, F̂YA)". The scale runs from 0.0 to 0.7, with major gridlines at intervals of 0.1.
* **X-axis:** Labeled "Feature Name (X)". It lists six categorical features:
1. Race
2. Sex
3. UGPA (Undergraduate GPA)
4. LSAT (Law School Admission Test score)
5. ε_UGPA (likely the error or residual term for UGPA)
6. ε_LSAT (likely the error or residual term for LSAT)
* **Legend:** Positioned at the bottom of the chart. It defines four data series by color:
* **Blue:** Unfair
* **Brown:** CFP
* **Pink:** FairPFN
* **Olive Green:** Cntf. Avg. (likely Counterfactual Average)
### Detailed Analysis
The chart presents correlation values for each feature across the four methods. Values are approximate based on visual inspection against the y-axis gridlines.
**1. Race:**
* **Unfair (Blue):** Shows a high correlation of approximately **0.50**.
* **CFP (Brown):** Correlation is near zero, approximately **0.00**.
* **FairPFN (Pink):** Shows a very low correlation of approximately **0.02**.
* **Cntf. Avg. (Olive):** Correlation is near zero, approximately **0.00**.
* *Trend:* The "Unfair" model has a strong correlation with Race, while the other three methods show negligible correlation.
**2. Sex:**
* **Unfair (Blue):** Correlation is near zero, approximately **0.00**.
* **CFP (Brown):** Correlation is near zero, approximately **0.00**.
* **FairPFN (Pink):** Shows a low correlation of approximately **0.11**.
* **Cntf. Avg. (Olive):** Shows a low correlation of approximately **0.08**.
* *Trend:* All correlations are low. "FairPFN" and "Cntf. Avg." show a slight positive correlation, while "Unfair" and "CFP" show none.
**3. UGPA:**
* **Unfair (Blue):** Correlation of approximately **0.41**.
* **CFP (Brown):** Correlation of approximately **0.45**.
* **FairPFN (Pink):** Correlation of approximately **0.40**.
* **Cntf. Avg. (Olive):** Correlation of approximately **0.36**.
* *Trend:* All methods show a moderate positive correlation with UGPA. "CFP" is the highest, and "Cntf. Avg." is the lowest in this group.
**4. LSAT:**
* **Unfair (Blue):** Correlation of approximately **0.62**.
* **CFP (Brown):** Correlation of approximately **0.63**.
* **FairPFN (Pink):** Correlation of approximately **0.67**.
* **Cntf. Avg. (Olive):** Correlation of approximately **0.70**.
* *Trend:* This feature shows the highest correlations across all methods. There is a clear increasing trend from "Unfair" to "Cntf. Avg.", with the latter reaching the highest value on the entire chart.
**5. ε_UGPA:**
* **Unfair (Blue):** Correlation of approximately **0.41**.
* **CFP (Brown):** Correlation of approximately **0.55**.
* **FairPFN (Pink):** Correlation of approximately **0.57**.
* **Cntf. Avg. (Olive):** Correlation of approximately **0.62**.
* *Trend:* Similar to LSAT, correlations are moderate to high and increase from "Unfair" to "Cntf. Avg.".
**6. ε_LSAT:**
* **Unfair (Blue):** Correlation of approximately **0.41**.
* **CFP (Brown):** Correlation of approximately **0.55**.
* **FairPFN (Pink):** Correlation of approximately **0.57**.
* **Cntf. Avg. (Olive):** Correlation of approximately **0.62**.
* *Trend:* The pattern and values are nearly identical to those for ε_UGPA.
### Key Observations
1. **Disparity in Sensitive Attributes:** The "Unfair" model has a high correlation with "Race" (~0.50), while the fairness-aware methods (CFP, FairPFN, Cntf. Avg.) reduce this correlation to near zero. This is the most dramatic difference in the chart.
2. **Strong Predictor:** "LSAT" has the highest overall correlations, suggesting it is the strongest predictor of the output F̂YA across all models.
3. **Method Performance Gradient:** For the academic features (UGPA, LSAT) and their error terms (ε_UGPA, ε_LSAT), there is a consistent pattern where the correlation increases in the order: Unfair < CFP ≈ FairPFN < Cntf. Avg.
4. **Low Impact of Sex:** The correlation with "Sex" is low for all methods, indicating this feature has a weak relationship with the model's output in this analysis.
### Interpretation
This chart likely comes from a study on algorithmic fairness in law school admissions predictions. It evaluates how different modeling approaches ("Unfair" baseline vs. fairness-constrained methods like CFP and FairPFN) affect the model's reliance on sensitive attributes (Race, Sex) versus legitimate predictive features (UGPA, LSAT).
* **What the data suggests:** The "Unfair" model appears to use Race as a significant factor in its predictions, which is a potential source of bias. The fairness methods successfully decouple the model's output from Race, reducing its correlation to near zero. However, for the academic metrics (UGPA, LSAT) and their residuals, the fairness methods—especially "Cntf. Avg."—show *increased* correlation. This could imply that to achieve fairness with respect to Race, the models place even greater weight on the (presumably) legitimate academic qualifications.
* **Relationship between elements:** The contrast between the "Race" group and the "LSAT" group is central. It visualizes the trade-off often encountered in fair ML: removing influence from a sensitive attribute may increase reliance on other features. The near-identical patterns for ε_UGPA and ε_LSAT suggest these residual terms behave similarly in the models.
* **Notable anomaly:** The "FairPFN" method shows a small but non-zero correlation with "Sex" (~0.11), which is higher than the other methods for that feature. This might be an unintended side effect of its fairness optimization process. The "Cntf. Avg." method achieves the highest correlations with the academic features, suggesting it might be the most "performance-focused" among the fairness-aware methods shown.