## Bar Chart: Law School Admissions
### Overview
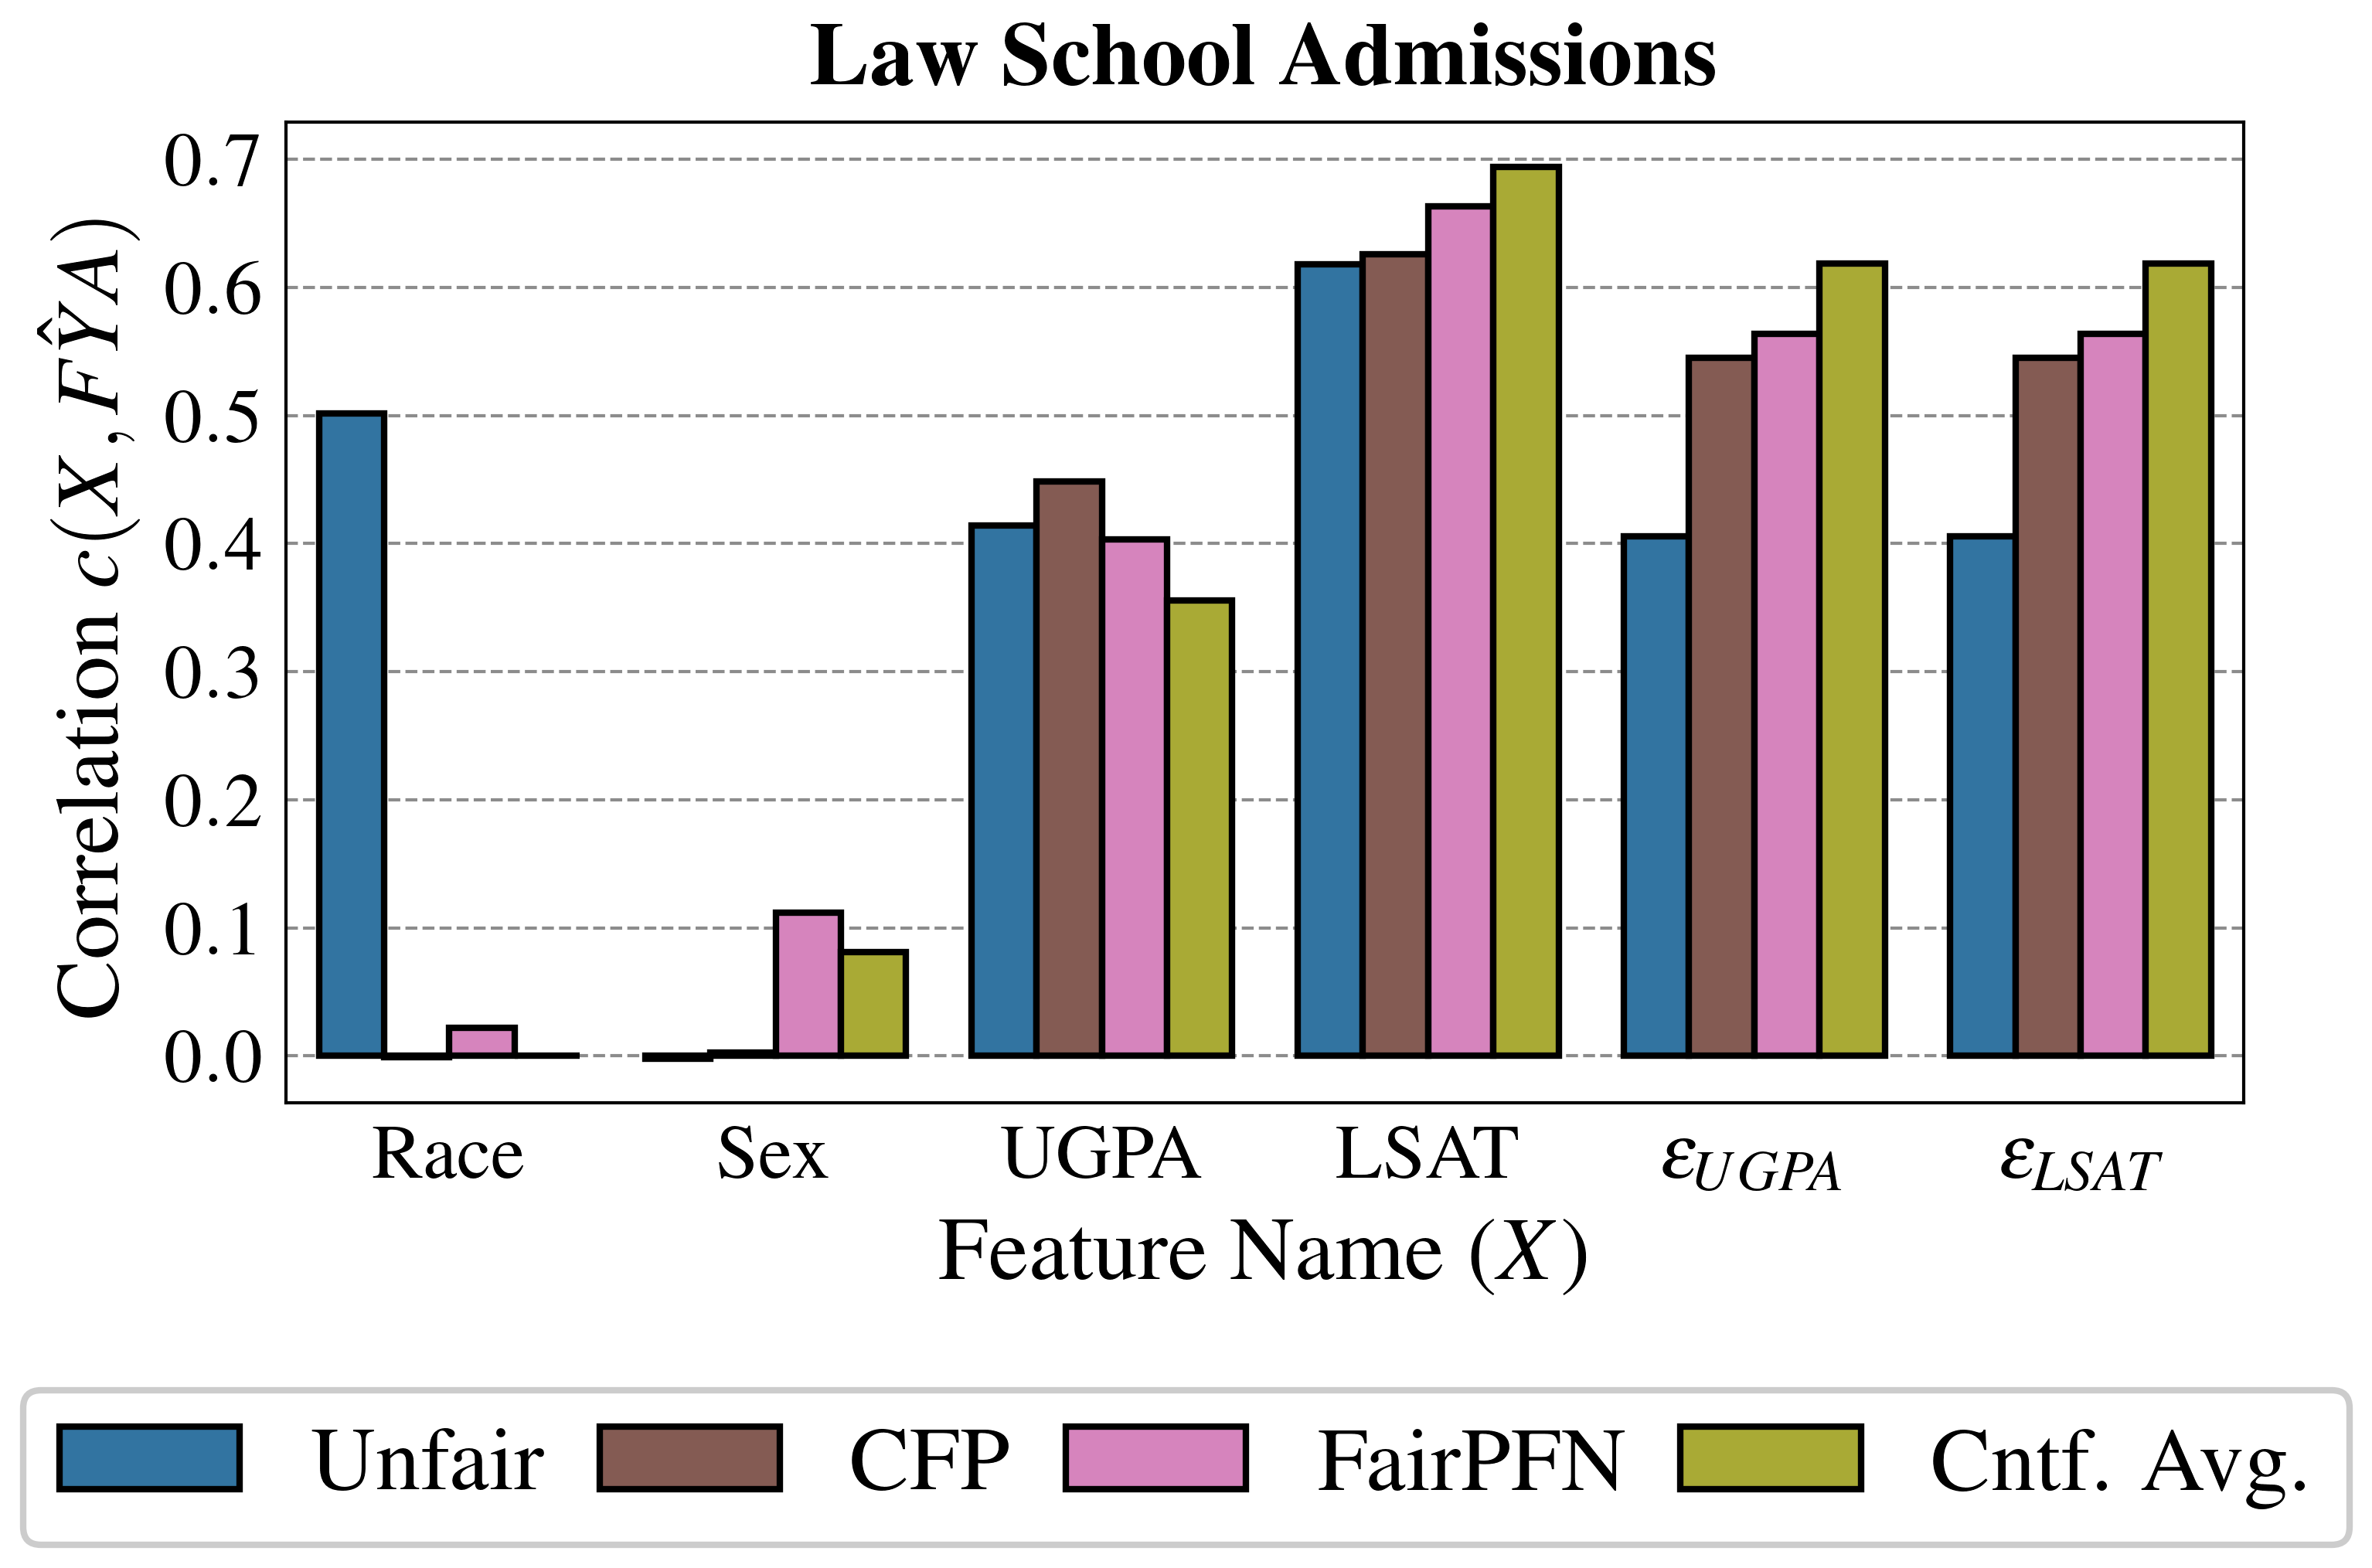
The chart visualizes the correlation coefficients between law school admission features (Race, Sex, UGPA, LSAT, εUGPA, εLSAT) and a target variable (FŶA). Four fairness metrics are compared: Unfair, CFP, FairPFN, and Cntf. Avg. (Cumulative Average). Bars represent correlation strength (0–0.7) for each feature-metric pair.
### Components/Axes
- **X-axis**: Feature Names (Race, Sex, UGPA, LSAT, εUGPA, εLSAT)
- **Y-axis**: Correlation coefficient (labeled "Correlation c(X, FŶA)")
- **Legend**:
- Blue: Unfair
- Brown: CFP
- Pink: FairPFN
- Green: Cntf. Avg.
- **ε Features**: Likely represent transformed/adjusted versions of UGPA/LSAT (e.g., εUGPA = adjusted UGPA).
### Detailed Analysis
1. **Race**:
- Unfair: ~0.5 (highest correlation)
- CFP/FairPFN/Cntf. Avg.: ~0.01–0.05 (near-zero correlation)
- *Trend*: Unfair metric dominates; other metrics show negligible association.
2. **Sex**:
- Unfair: ~0.1
- CFP: ~0.12
- FairPFN: ~0.05
- Cntf. Avg.: ~0.08
- *Trend*: CFP slightly outperforms others, but all correlations are weak.
3. **UGPA**:
- Unfair: ~0.42
- CFP: ~0.45
- FairPFN: ~0.40
- Cntf. Avg.: ~0.36
- *Trend*: CFP and Unfair metrics are strongest; Cntf. Avg. lags.
4. **LSAT**:
- Unfair: ~0.62
- CFP: ~0.63
- FairPFN: ~0.66
- Cntf. Avg.: ~0.69
- *Trend*: All metrics show strong positive correlation, with Cntf. Avg. leading.
5. **εUGPA**:
- Unfair: ~0.40
- CFP: ~0.55
- FairPFN: ~0.57
- Cntf. Avg.: ~0.62
- *Trend*: εUGPA improves CFP/FairPFN performance; Cntf. Avg. peaks.
6. **εLSAT**:
- Unfair: ~0.40
- CFP: ~0.55
- FairPFN: ~0.57
- Cntf. Avg.: ~0.62
- *Trend*: Mirrors εUGPA pattern; Cntf. Avg. dominates.
### Key Observations
- **LSAT/εLSAT**: Highest overall correlations (~0.6–0.7), suggesting strong predictive power for admissions.
- **Race**: Unfair metric shows disproportionately high correlation (~0.5), raising fairness concerns.
- **ε Features**: Adjusted variables (εUGPA/εLSAT) outperform raw features in CFP/FairPFN/Cntf. Avg. metrics.
- **Cntf. Avg.**: Consistently highest correlation across all features except Race.
### Interpretation
The chart highlights trade-offs between fairness and predictive accuracy in law school admissions:
1. **LSAT Dominance**: LSAT and εLSAT are the most predictive features, with Cntf. Avg. achieving the strongest correlation (~0.69). This suggests LSAT remains a critical factor in admissions models.
2. **Fairness vs. Bias**: The Unfair metric’s high correlation with Race (~0.5) implies potential racial bias in admissions algorithms using this metric. Other fairness methods (CFP, FairPFN) mitigate this but show weaker correlations.
3. **ε Feature Utility**: Adjusted variables (εUGPA/εLSAT) improve fairness metrics without sacrificing predictive power, indicating their value in balancing equity and accuracy.
4. **Cntf. Avg. Superiority**: This metric consistently outperforms others across features, suggesting it optimally balances fairness and utility.
The data underscores the need for careful feature selection and fairness metric choice in admissions algorithms to avoid perpetuating biases while maintaining predictive validity.