## Scatter Plot: Econometrics
### Overview
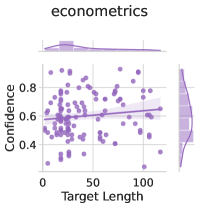
The image is a scatter plot titled "econometrics". It displays the relationship between "Target Length" on the x-axis and "Confidence" on the y-axis. The plot includes a regression line with a confidence interval, and marginal distributions (histograms) for both variables are shown along the top and right edges of the scatter plot.
### Components/Axes
* **Title:** econometrics
* **X-axis:** Target Length
* Scale ranges from 0 to 100, with tick marks at approximately 0, 50, and 100.
* **Y-axis:** Confidence
* Scale ranges from 0.4 to 0.8, with tick marks at approximately 0.4, 0.6, and 0.8.
* **Data Points:** Purple dots representing individual data points.
* **Regression Line:** A purple line showing the linear relationship between Target Length and Confidence.
* **Confidence Interval:** A shaded purple region around the regression line, indicating the uncertainty in the estimated relationship.
* **Marginal Distribution (Top):** A histogram showing the distribution of Target Length.
* **Marginal Distribution (Right):** A histogram showing the distribution of Confidence.
### Detailed Analysis
* **Data Points:** The data points are scattered across the plot, with a higher concentration between Target Length values of 0 and 50.
* **Regression Line:** The regression line has a slight positive slope, suggesting a weak positive correlation between Target Length and Confidence.
* **Confidence Interval:** The confidence interval widens slightly as Target Length increases, indicating greater uncertainty in the relationship at higher Target Length values.
* **Marginal Distribution (Target Length):** The distribution is skewed to the right, indicating that most data points have lower Target Length values.
* **Marginal Distribution (Confidence):** The distribution appears roughly normal, centered around a Confidence value of approximately 0.6.
### Key Observations
* There is a weak positive correlation between Target Length and Confidence.
* The majority of data points have Target Length values between 0 and 50.
* The Confidence values are relatively consistent, with most values falling between 0.5 and 0.7.
### Interpretation
The scatter plot suggests that there is a slight positive relationship between Target Length and Confidence, but the correlation is weak. The data points are scattered, and the confidence interval is relatively wide, indicating that the relationship is not very strong. The marginal distributions show that most data points have lower Target Length values and that the Confidence values are relatively consistent. Overall, the plot suggests that Target Length may have a small influence on Confidence, but other factors are likely more important.