\n
## Scatter Plot with Marginal Distributions: Econometrics Confidence vs. Target Length
### Overview
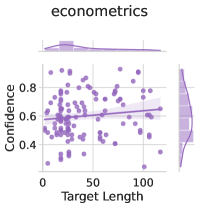
The image is a statistical visualization, specifically a scatter plot with marginal histograms (also known as a joint plot). It displays the relationship between two variables: "Target Length" on the horizontal axis and "Confidence" on the vertical axis. The plot is titled "econometrics," which also serves as the label for the single data series shown. The overall aesthetic uses a monochromatic purple color scheme against a white background with a light gray grid.
### Components/Axes
* **Main Chart Area:** A scatter plot with approximately 60-70 data points, each represented by a semi-transparent purple circle.
* **X-Axis (Horizontal):**
* **Label:** "Target Length"
* **Scale:** Linear scale ranging from 0 to 100.
* **Major Tick Marks:** At 0, 50, and 100.
* **Y-Axis (Vertical):**
* **Label:** "Confidence"
* **Scale:** Linear scale ranging from 0.4 to 0.8.
* **Major Tick Marks:** At 0.4, 0.6, and 0.8.
* **Legend:**
* **Position:** Top-left corner of the main chart area.
* **Content:** A single entry with a purple circle icon and the text "econometrics".
* **Marginal Distributions:**
* **Top Histogram:** Aligned with the X-axis ("Target Length"). Shows the frequency distribution of the Target Length variable.
* **Right Histogram:** Aligned with the Y-axis ("Confidence"). Shows the frequency distribution of the Confidence variable.
* **Grid:** A light gray grid is present in the main chart area, with lines corresponding to the major tick marks on both axes.
### Detailed Analysis
* **Data Series Trend:** The scatter plot shows a **weak positive correlation**. As "Target Length" increases, "Confidence" shows a slight tendency to increase. The data points are widely scattered, indicating high variance and a low R-squared value if a linear regression were fitted.
* **Data Point Distribution:**
* **Target Length (X-axis):** Data points are concentrated between approximately 10 and 80. There are very few points near 0 or 100.
* **Confidence (Y-axis):** Data points are concentrated between approximately 0.45 and 0.75. The majority of points lie between 0.5 and 0.7.
* **Marginal Histogram Details:**
* **Top (Target Length):** The distribution appears roughly unimodal and slightly right-skewed. The highest frequency bin is in the range of approximately 25-50.
* **Right (Confidence):** The distribution appears roughly unimodal and symmetric, centered around 0.6-0.65.
* **Spatial Grounding & Outliers:**
* A small cluster of points with low Confidence (~0.45-0.5) exists across a range of Target Lengths (approx. 10-60).
* A few points with high Confidence (>0.7) are scattered, with one notable point at approximately (Target Length=70, Confidence=0.78).
* The point with the highest Target Length (~95) has a moderate Confidence value of ~0.62.
### Key Observations
1. **Weak Positive Relationship:** The primary observation is the faint upward slope of the data cloud, suggesting that longer targets are associated with slightly higher confidence scores, but the relationship is not strong.
2. **High Variability:** For any given Target Length, there is a wide range of Confidence values. For example, at a Target Length of ~50, Confidence values span from below 0.5 to above 0.7.
3. **Central Tendency:** Both variables show central tendencies: Target Length is most common in the 25-50 range, and Confidence is most common around 0.6-0.65.
4. **Absence of Extreme Values:** There are no data points at the extreme ends of the scales (e.g., Target Length <5 or >95; Confidence <0.4 or >0.8).
### Interpretation
This plot likely visualizes the performance or output of an econometric model. "Target Length" could refer to the time horizon of a forecast, the complexity of an economic variable, or the length of an input sequence. "Confidence" likely represents the model's predicted probability or certainty in its output.
The **weak positive correlation** suggests that the model's confidence increases marginally as the target length increases. This could imply the model is slightly more certain about longer-term projections or that it has more data to work with for longer targets. However, the **high variability** is the more dominant feature. It indicates that target length alone is a poor predictor of the model's confidence. Other factors not shown in this two-dimensional plot (e.g., model parameters, input data quality, economic volatility) are likely major drivers of confidence.
The marginal histograms confirm that the dataset used is not uniformly distributed; it is centered around moderate target lengths and moderate confidence levels. The absence of extreme values might indicate data filtering or the inherent limits of the model's operational range.
**In summary, the visualization demonstrates that while there is a faint signal linking longer targets to higher confidence, the model's certainty is highly variable and influenced by factors beyond simple target length.**