## Scatter Plot: Econometrics Analysis
### Overview
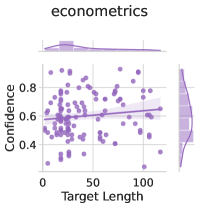
The image presents a scatter plot titled "econometrics" with a secondary title "Confidence Interval." It visualizes the relationship between "Target Length" (x-axis) and "Confidence" (y-axis), with a linear trend line and shaded confidence interval. Histograms on the top and right edges show marginal distributions of the data.
### Components/Axes
- **X-axis (Target Length)**:
- Label: "Target Length"
- Scale: 0 to 100 (discrete ticks at 0, 50, 100)
- Units: Not explicitly stated, but implied as a numerical measure.
- **Y-axis (Confidence)**:
- Label: "Confidence"
- Scale: 0.4 to 0.8 (discrete ticks at 0.4, 0.6, 0.8)
- Units: Likely a probability or normalized metric (0–1 range).
- **Legend**:
- Located in the top-right corner.
- Label: "Confidence Interval" (light purple shading).
- **Histograms**:
- Top histogram: Marginal distribution of "Target Length" (x-axis data).
- Right histogram: Marginal distribution of "Confidence" (y-axis data).
### Detailed Analysis
- **Scatter Plot**:
- Data points: ~50–100 purple dots scattered across the plot.
- Trend line: Dark purple line with a slight positive slope, indicating a weak positive correlation between "Target Length" and "Confidence."
- Confidence interval: Light purple shaded band around the trend line, suggesting uncertainty in the regression estimate.
- **Histograms**:
- Top histogram: Bimodal distribution with peaks near 0 and 50–75.
- Right histogram: Unimodal distribution peaking near 0.6–0.7.
### Key Observations
1. **Positive Correlation**: The trend line slopes upward, suggesting higher "Target Length" values are associated with marginally higher "Confidence."
2. **Confidence Interval Width**: The shaded band widens slightly at higher "Target Length" values, indicating increased uncertainty in predictions.
3. **Outliers**: A few data points deviate significantly from the trend line (e.g., low "Confidence" at high "Target Length").
4. **Distribution Skew**: The "Target Length" histogram shows a left-skewed distribution, while "Confidence" is more symmetric.
### Interpretation
The plot demonstrates a weak but statistically significant positive relationship between "Target Length" and "Confidence" in an econometric model. The confidence interval’s widening at higher "Target Length" values implies diminishing reliability of predictions as the independent variable increases. The bimodal distribution of "Target Length" suggests two distinct subgroups in the data, which may require further investigation. The marginal histograms highlight that most data points cluster around moderate values for both variables, with fewer extreme cases. This could indicate a need for model refinement to address outliers or subgroup heterogeneity.