\n
## Charts: Performance Comparison of MLA, GDN-H, and Kimi Linear
### Overview
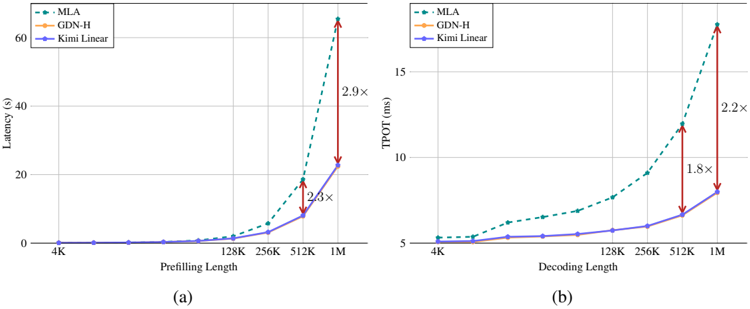
The image presents two line charts (labeled (a) and (b)) comparing the performance of three models – MLA, GDN-H, and Kimi Linear – under varying input lengths. Chart (a) shows Latency (in seconds) versus Prefilling Length, while chart (b) shows TPOT (Time Per Output Token, in milliseconds) versus Decoding Length. Both charts use a logarithmic scale for the input length (Prefilling/Decoding Length). Arrows indicate the performance increase/decrease between 512K and 1M input lengths.
### Components/Axes
**Chart (a): Latency vs. Prefilling Length**
* **X-axis:** Prefilling Length (0K, 128K, 256K, 512K, 1M)
* **Y-axis:** Latency (s) (Scale: 0 to 60, increments of 10)
* **Legend (top-left):**
* MLA (Teal dashed line)
* GDN-H (Orange solid line)
* Kimi Linear (Blue solid line)
**Chart (b): TPOT vs. Decoding Length**
* **X-axis:** Decoding Length (4K, 128K, 256K, 512K, 1M)
* **Y-axis:** TPOT (ms) (Scale: 5 to 20, increments of 5)
* **Legend (top-left):**
* MLA (Teal dashed line)
* GDN-H (Orange solid line)
* Kimi Linear (Blue solid line)
### Detailed Analysis or Content Details
**Chart (a): Latency vs. Prefilling Length**
* **Kimi Linear (Blue):** The line is nearly flat from 0K to 512K, remaining around 1-2 seconds. It increases sharply to approximately 23 seconds at 1M.
* **GDN-H (Orange):** The line is also relatively flat from 0K to 512K, staying around 1-3 seconds. It increases to approximately 25 seconds at 1M.
* **MLA (Teal):** The line is flat from 0K to 256K, remaining below 1 second. It begins to increase significantly at 512K (approximately 8 seconds) and rises dramatically to approximately 58 seconds at 1M. An arrow indicates a 2.9x increase in latency from 512K to 1M. Another arrow indicates a 2.3x increase in latency from 512K to 1M.
**Chart (b): TPOT vs. Decoding Length**
* **Kimi Linear (Blue):** The line is relatively flat from 4K to 512K, staying around 6-8 ms. It increases to approximately 11 ms at 1M.
* **GDN-H (Orange):** The line is flat from 4K to 256K, remaining around 6-7 ms. It increases to approximately 11 ms at 1M.
* **MLA (Teal):** The line is flat from 4K to 256K, remaining around 6-7 ms. It begins to increase at 512K (approximately 9 ms) and rises to approximately 19 ms at 1M. An arrow indicates a 2.2x increase in TPOT from 512K to 1M. Another arrow indicates a 1.8x increase in TPOT from 512K to 1M.
### Key Observations
* **Scaling Issues:** MLA exhibits the most significant performance degradation as the input length increases, particularly in terms of latency.
* **Linearity:** Kimi Linear and GDN-H show more linear scaling with input length compared to MLA.
* **TPOT vs. Latency:** The trends in TPOT are similar to those in latency, but the magnitude of the increase is less pronounced.
* **Performance Gap:** The performance gap between MLA and the other two models widens considerably at larger input lengths.
### Interpretation
These charts demonstrate the scalability of three different models (MLA, GDN-H, and Kimi Linear) when processing longer sequences. The data suggests that MLA, while potentially faster for shorter sequences, suffers from significant performance bottlenecks as the input length grows. This is evidenced by the steep increase in both latency and TPOT at 1M Prefilling/Decoding Length. GDN-H and Kimi Linear exhibit more stable performance, indicating better scalability.
The arrows highlighting the performance increases (2.9x, 2.3x for latency in (a), and 2.2x, 1.8x for TPOT in (b)) emphasize the substantial performance impact of increasing the input length for MLA. The logarithmic scale of the x-axis is crucial for understanding these trends, as it highlights the exponential nature of the performance degradation.
The consistent performance of Kimi Linear and GDN-H suggests that they may be more suitable for applications requiring processing of long sequences. The difference in performance between the models is likely due to architectural differences and optimization strategies. Further investigation into the underlying mechanisms driving these performance differences would be valuable.