## Line Charts: Latency and TPOT Performance Across Sequence Lengths
### Overview
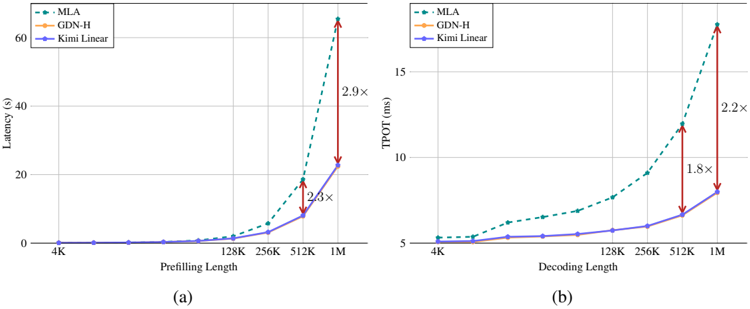
The image contains two line charts comparing the performance of three methods (MLA, GDN-H, Kimi Linear) across two metrics: **Latency (s)** and **TPOT (ms)**. Chart (a) focuses on **Prefilling Length**, while chart (b) examines **Decoding Length**. Both charts highlight performance degradation at longer sequence lengths using multiplier annotations (e.g., "2.9×").
---
### Components/Axes
#### Chart (a): Latency vs. Prefilling Length
- **X-axis**: Prefilling Length (4K, 128K, 256K, 512K, 1M)
- **Y-axis**: Latency (s), ranging from 0 to 60
- **Legend**: Top-left corner, with color-coded labels:
- MLA: Green dashed line
- GDN-H: Orange solid line
- Kimi Linear: Blue solid line
#### Chart (b): TPOT vs. Decoding Length
- **X-axis**: Decoding Length (4K, 128K, 256K, 512K, 1M)
- **Y-axis**: TPOT (ms), ranging from 5 to 15
- **Legend**: Top-left corner, matching chart (a) color scheme.
---
### Detailed Analysis
#### Chart (a): Latency Trends
1. **MLA (Green Dashed Line)**:
- Starts near 0 at 4K.
- Gradual increase up to 512K (~10s).
- Sharp spike at 1M (~60s), annotated with a **2.9×** multiplier compared to Kimi Linear.
- Intermediate spike at 512K (~20s), annotated with a **2.3×** multiplier.
2. **GDN-H (Orange Solid Line)**:
- Remains flat at 0 across all lengths.
3. **Kimi Linear (Blue Solid Line)**:
- Flat at 0 for all lengths except 1M (~20s), where it aligns with MLA's 512K latency.
#### Chart (b): TPOT Trends
1. **MLA (Green Dashed Line)**:
- Starts at ~5 ms at 4K.
- Gradual increase to ~15 ms at 1M, annotated with a **2.2×** multiplier.
- Intermediate jump at 512K (~12 ms), annotated with a **1.8×** multiplier.
2. **GDN-H (Orange Solid Line)**:
- Flat at ~5 ms across all lengths.
3. **Kimi Linear (Blue Solid Line)**:
- Flat at ~5 ms for 4K–256K.
- Slight increase to ~7 ms at 512K and ~10 ms at 1M.
---
### Key Observations
1. **MLA's Scalability Issues**:
- Latency and TPOT increase exponentially with longer sequences (e.g., 2.9× and 2.2× multipliers at 1M).
- Dominates performance degradation compared to other methods.
2. **GDN-H's Consistency**:
- Unchanged latency and TPOT across all lengths, suggesting fixed computational cost.
3. **Kimi Linear's Stability**:
- Minimal performance variation, except for a modest TPOT increase at 1M.
4. **Multiplier Annotations**:
- Highlight MLA's inefficiency at scale, particularly for 1M sequences.
---
### Interpretation
- **MLA's Limitations**: The sharp performance drops at 1M suggest MLA struggles with long sequences, likely due to quadratic or higher complexity in its architecture.
- **GDN-H's Efficiency**: Flat performance indicates a design optimized for constant-time operations, making it suitable for variable-length tasks.
- **Kimi Linear's Trade-off**: While stable, its slight TPOT increase at 1M hints at potential limitations in extreme-scale scenarios.
- **Practical Implications**: For applications requiring long sequences (e.g., genomics, large-scale NLP), GDN-H may be preferable to MLA despite similar baseline performance.
---
### Spatial Grounding & Validation
- **Legend Placement**: Top-left in both charts, ensuring clear association with line colors.
- **Data Point Validation**:
- MLA's 1M latency (60s) matches the 2.9× multiplier relative to Kimi Linear (20s).
- TPOT annotations align with relative line positions (e.g., 2.2× at 1M).
---
### Content Details
- **Chart (a) Data Points**:
- MLA: 4K (0s), 128K (~2s), 256K (~5s), 512K (~20s), 1M (~60s).
- Kimi Linear: 1M (~20s).
- **Chart (b) Data Points**:
- MLA: 4K (5ms), 128K (~7ms), 256K (~9ms), 512K (~12ms), 1M (~15ms).
- Kimi Linear: 1M (~10ms).
---
### Final Notes
The charts emphasize trade-offs between computational efficiency and sequence length handling. MLA's performance degradation at scale raises questions about its suitability for real-time or resource-constrained applications, while GDN-H and Kimi Linear offer more predictable behavior.