\n
## Chart: Importance Score vs. Reasoning Step
### Overview
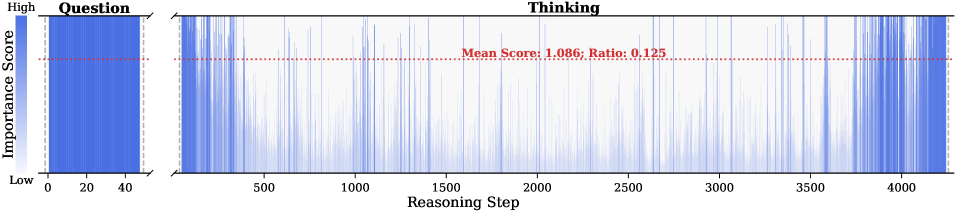
The image presents a chart visualizing the "Importance Score" across "Reasoning Steps". The chart appears to represent a comparison between the initial "Question" phase and the subsequent "Thinking" phase of a reasoning process. The chart is a bar-like representation, with the x-axis representing the reasoning step and the y-axis representing the importance score.
### Components/Axes
* **X-axis:** "Reasoning Step", ranging from approximately 0 to 4000.
* **Y-axis:** "Importance Score", ranging from "Low" to "High".
* **Chart Sections:** Two distinct sections are labeled: "Question" (from 0 to approximately 40 Reasoning Steps) and "Thinking" (from approximately 40 to 4000 Reasoning Steps).
* **Horizontal Line:** A dashed horizontal line is present, labeled "Mean Score: 1.086; Ratio: 0.125".
* **Color Scheme:** The "Question" section is filled with a solid blue color. The "Thinking" section consists of numerous thin, vertical blue bars fluctuating around the mean score line.
### Detailed Analysis
The "Question" section is a single, solid blue bar. Its height indicates a relatively high importance score. The bar extends from approximately Reasoning Step 0 to 40. The importance score appears to be approximately 2.5, but this is an estimate based on the visual scale.
The "Thinking" section, spanning from Reasoning Step 40 to 4000, is composed of many narrow vertical bars. These bars fluctuate significantly above and below the horizontal "Mean Score" line. The bars appear to be randomly distributed around the mean.
* **Mean Score:** 1.086
* **Ratio:** 0.125
The distribution of the bars in the "Thinking" section suggests a high degree of variability in the importance score during the reasoning process.
### Key Observations
* The "Question" phase exhibits a consistently high importance score, significantly higher than the mean score observed in the "Thinking" phase.
* The "Thinking" phase demonstrates a highly variable importance score, with fluctuations above and below the mean.
* The ratio of 0.125 suggests a relationship between the mean score and some other value, but the context of this ratio is not provided in the image.
### Interpretation
The chart suggests that the initial "Question" phase of a reasoning process is characterized by a high degree of importance, while the subsequent "Thinking" phase involves a more fluctuating and variable level of importance. The high variability in the "Thinking" phase could indicate that different reasoning steps contribute varying degrees of importance to the overall process. The mean score and ratio provide quantitative measures of the overall importance and its relationship to another factor, but the meaning of the ratio is unclear without additional context. The chart could be illustrating the cognitive effort or attention allocated to different stages of problem-solving. The initial question is highly focused, while the thinking phase involves exploration and potentially less focused attention.