## Bar Chart: Importance Score Distribution Across Question and Reasoning Steps
### Overview
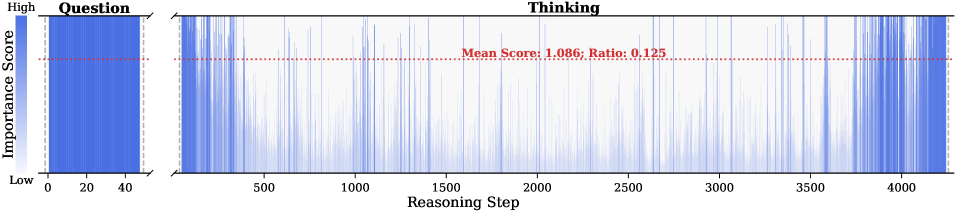
The image is a horizontal bar chart comparing the importance scores of two sections: "Question" and "Thinking". The y-axis represents "Importance Score" (ranging from "Low" to "High"), while the x-axis represents "Reasoning Step" (0 to 4000). A red dashed line labeled "Mean Score: 1.086; Ratio: 0.125" spans the chart horizontally, serving as a reference for average importance.
### Components/Axes
- **Y-Axis (Importance Score)**:
- Labeled "Importance Score" with a gradient from light blue (low) to dark blue (high).
- No numerical scale provided, but the gradient implies a continuous range.
- **X-Axis (Reasoning Step)**:
- Labeled "Reasoning Step" with a linear scale from 0 to 4000.
- Divided into two regions:
- **Question**: 0–40 (solid blue bar).
- **Thinking**: 40–4000 (variable blue bars).
- **Legend**:
- Located on the left, with a single entry: "High" (dark blue) and "Low" (light blue).
- **Red Dashed Line**:
- Positioned horizontally across the chart, labeled with "Mean Score: 1.086; Ratio: 0.125".
### Detailed Analysis
- **Question Section**:
- A single solid blue bar spans the entire 0–40 range on the x-axis.
- The bar is uniformly dark blue, indicating a high importance score.
- **Thinking Section**:
- Composed of numerous vertical blue bars (likely representing individual reasoning steps).
- Bars vary in height, with some reaching the "High" end of the y-axis and others near the "Low" end.
- The red dashed line (mean score) intersects the "Thinking" section, suggesting an average importance score of 1.086.
- The "Ratio: 0.125" is annotated on the red line, though its reference value is not explicitly stated (e.g., ratio of mean to maximum, or mean to question score).
### Key Observations
1. **Question Importance**: The "Question" section has a consistently high importance score, as indicated by the solid dark blue bar.
2. **Thinking Variability**: The "Thinking" section shows significant variability in importance scores, with some steps rated highly and others low.
3. **Mean Score**: The red dashed line (mean score of 1.086) is slightly above the baseline (assuming a baseline of 1.0), indicating an average importance slightly above neutral.
4. **Ratio Ambiguity**: The "Ratio: 0.125" is unclear without additional context (e.g., is it the mean divided by the question's score, or the mean divided by the maximum possible score?).
### Interpretation
- The chart highlights that the **question itself is critically important**, while the **reasoning steps exhibit mixed importance**. The mean score of 1.086 suggests that, on average, reasoning steps are moderately important, but the variability (e.g., some steps rated highly, others low) indicates inconsistency in their perceived value.
- The "Ratio: 0.125" likely reflects a proportional relationship (e.g., the mean score is 12.5% of a reference value), but without explicit context, its significance remains speculative. This could imply that the average importance of reasoning steps is a small fraction of the question's importance or another metric.
- The red dashed line serves as a visual anchor, emphasizing that the average importance of reasoning steps is relatively low compared to the question's high score.
### Spatial Grounding
- **Legend**: Left side, aligned with the y-axis.
- **Red Dashed Line**: Centered horizontally, spanning the entire chart.
- **Question Section**: Leftmost 40 units on the x-axis.
- **Thinking Section**: Rightmost 3960 units on the x-axis.
### Content Details
- **Question**: Single bar (0–40) with dark blue color (high importance).
- **Thinking**: Multiple bars (40–4000) with varying blue shades (low to high importance).
- **Mean Score**: 1.086 (red dashed line).
- **Ratio**: 0.125 (annotated on the red line).
### Notable Trends
- The "Question" section is a single, uniform bar, while the "Thinking" section shows no clear trend (e.g., no gradual increase or decrease in importance).
- The red dashed line (mean) is positioned slightly above the baseline, suggesting a slight overall positive bias in reasoning step importance.
### Conclusion
The chart underscores the critical role of the question in the reasoning process, contrasted with the variable importance of individual reasoning steps. The mean score and ratio provide quantitative context but require further clarification to fully interpret their implications.