## Diagram: Knowledge Poisoning Attack
### Overview
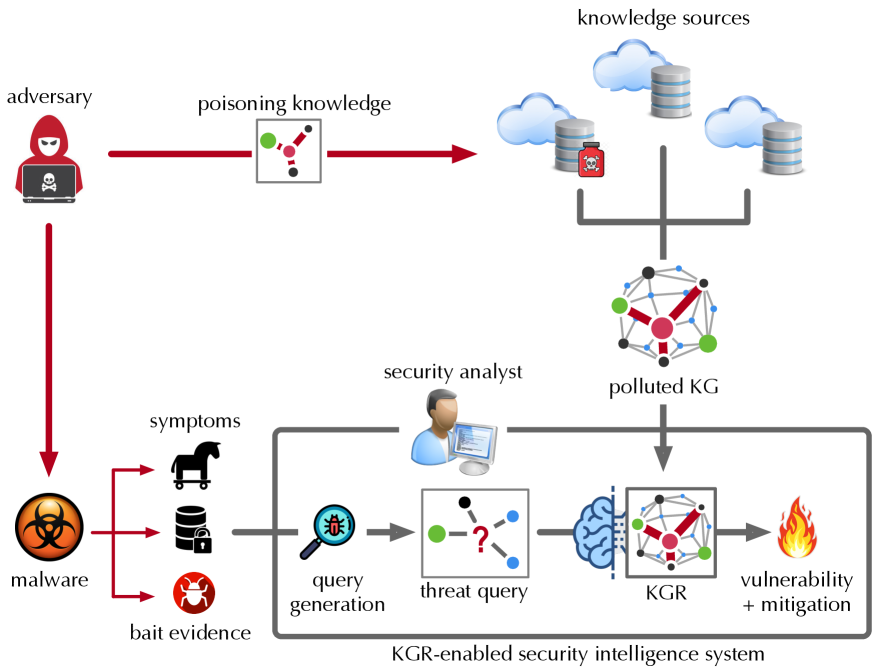
The image illustrates a knowledge poisoning attack on a security intelligence system. It shows how an adversary can inject malicious information into knowledge sources, leading to a polluted knowledge graph (KG) and ultimately affecting vulnerability mitigation.
### Components/Axes
* **Adversary:** Represented by a hooded figure with a laptop, located at the top-left.
* **Poisoning Knowledge:** A red arrow from the adversary leads to a node representing poisoned knowledge. This node has red, green, and gray connections.
* **Knowledge Sources:** Cloud and database icons at the top-right, representing sources of information. A poison bottle icon is superimposed on one of the databases.
* **Polluted KG:** A network graph with red, green, and black nodes, located below the knowledge sources.
* **Security Analyst:** A person using a computer, located in the middle-left.
* **Malware:** A biohazard symbol at the bottom-left.
* **Symptoms:** Icons representing a Trojan horse, database, and bug, connected to the malware.
* **Bait Evidence:** Text label associated with the symptoms.
* **Query Generation:** A magnifying glass icon over a document, located in the bottom-center.
* **Threat Query:** A node with a question mark, connected to the query generation.
* **KGR:** A knowledge graph representation, located to the right of the threat query. It has red, green, and gray connections.
* **Vulnerability + Mitigation:** A flame icon at the bottom-right.
* **KGR-enabled security intelligence system:** Text label below the query generation, threat query, KGR, and vulnerability + mitigation components.
### Detailed Analysis
* The adversary injects "poisoning knowledge" into the "knowledge sources". This is represented by a red arrow.
* The "knowledge sources" feed into a "polluted KG".
* The "malware" generates "symptoms" and "bait evidence".
* The "security analyst" uses "query generation" to create a "threat query".
* The "threat query" is processed by the "KGR" to identify "vulnerability + mitigation".
* The entire process from "query generation" to "vulnerability + mitigation" is part of a "KGR-enabled security intelligence system".
### Key Observations
* The diagram highlights the flow of information from the adversary to the security intelligence system.
* The "poisoning knowledge" is a critical point of attack.
* The "polluted KG" is a result of the attack.
* The "KGR-enabled security intelligence system" is designed to detect and mitigate vulnerabilities.
### Interpretation
The diagram illustrates a knowledge poisoning attack, where an adversary injects malicious information into the knowledge sources used by a security intelligence system. This leads to a polluted knowledge graph, which can affect the system's ability to accurately identify and mitigate vulnerabilities. The diagram emphasizes the importance of protecting knowledge sources from poisoning attacks and ensuring the integrity of the knowledge graph. The KGR-enabled security intelligence system is designed to address this threat, but its effectiveness depends on the quality of the knowledge graph.