## Diagram: KGR-Enabled Security Intelligence System Threat Model
### Overview
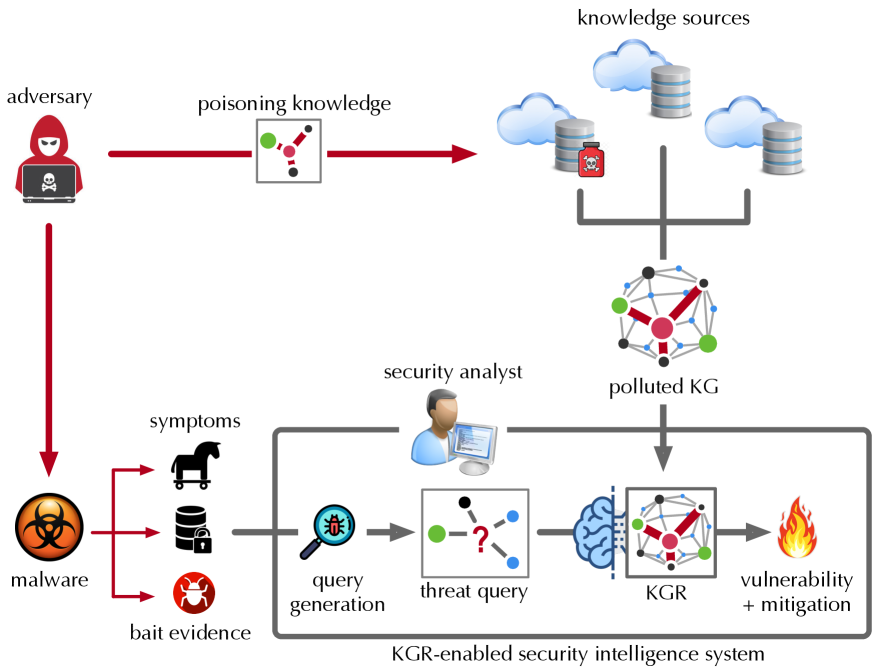
This diagram illustrates a cyber-security threat model involving an adversary who executes a two-pronged attack: data poisoning of knowledge sources and the deployment of malware. The diagram depicts how these actions flow into a "KGR-enabled security intelligence system," where a security analyst attempts to identify vulnerabilities and mitigations using Knowledge Graph Reasoning (KGR), potentially compromised by the adversary's actions.
### Components/Axes
The diagram is organized into a workflow with distinct functional areas:
* **Adversary (Top-Left):** Represented by a hooded figure with a laptop.
* **Knowledge Poisoning Path (Top):**
* **Poisoning Knowledge:** A graph icon with a red node.
* **Knowledge Sources:** Three cloud icons, each containing a database cylinder. One database is marked with a red poison/skull icon.
* **Polluted KG:** A complex network graph icon with thick red lines and nodes.
* **Malware/Symptoms Path (Bottom-Left):**
* **Malware:** A biohazard symbol.
* **Symptoms:** Three icons representing a Trojan horse, a locked database, and a bug.
* **Bait Evidence:** Label associated with the bug icon.
* **KGR-Enabled Security Intelligence System (Bottom-Center/Right):** A large, grey-outlined box containing:
* **Security Analyst:** An icon of a person at a computer.
* **Query Generation:** A magnifying glass icon inspecting a bug.
* **Threat Query:** A graph icon with a question mark.
* **KGR:** A brain icon connected to a network graph.
* **Vulnerability + Mitigation:** A fire icon.
### Detailed Analysis
**1. The Poisoning Workflow (Top Section):**
* The **Adversary** initiates a "poisoning knowledge" action (indicated by a thick red arrow).
* This action targets the **Knowledge Sources** (the clouds).
* The result is a **Polluted KG** (Knowledge Graph). The visual representation of the KG shows thick red lines, suggesting that the poisoned data has propagated through the network structure.
**2. The Malware/Detection Workflow (Bottom-Left Section):**
* The **Adversary** deploys **Malware** (biohazard icon).
* This malware manifests as **Symptoms** (Trojan horse, locked database, bug).
* The "bug" icon is specifically labeled as **Bait evidence**.
**3. The System Processing (Inside the KGR-Enabled System Box):**
* The **Security Analyst** oversees the process.
* The flow moves from the **Symptoms/Bait evidence** into **Query generation** (magnifying glass).
* This generates a **Threat query** (graph with a question mark).
* The query is processed by the **KGR** (Knowledge Graph Reasoning) engine, which is depicted as a brain icon connected to a network graph.
* The final output of the system is **Vulnerability + mitigation** (fire icon).
### Key Observations
* **Data Flow:** There are two distinct entry points for the adversary: one targeting the *knowledge base* (poisoning) and one targeting the *system environment* (malware).
* **Visual Metaphors:**
* The "poisoning" is represented by a red skull icon on a database and red lines in the graph, signifying corruption.
* The "KGR" is represented by a brain, implying an AI or machine-learning-based reasoning component.
* **System Integration:** The "Security Analyst" is positioned as a central figure, interacting with the query generation and the KGR engine, suggesting human-in-the-loop oversight.
### Interpretation
This diagram demonstrates a sophisticated attack vector known as **Knowledge Poisoning** against an AI-driven security system.
* **The Core Threat:** The adversary is not just attacking the target system directly with malware; they are attacking the *intelligence* of the system. By poisoning the "knowledge sources," the adversary ensures that the "Polluted KG" contains false or misleading information.
* **The Consequence:** When the "KGR" (Knowledge Graph Reasoning) engine processes a "threat query" based on the "polluted KG," the resulting "vulnerability + mitigation" output may be flawed. The system might fail to identify the actual malware, or it might suggest incorrect mitigations, effectively blinding the security analyst or leading them to take ineffective actions.
* **Peircean Investigative View:** The diagram suggests a "Trojan Horse" style of data manipulation. The "bait evidence" implies the adversary is intentionally leaving traces to trigger the system's detection mechanisms, ensuring the system processes the poisoned data. The system is designed to be "KGR-enabled," but the diagram serves as a warning that if the underlying knowledge graph is compromised, the reasoning engine's output becomes untrustworthy.