\n
## Diagram: KGR-enabled Security Intelligence System
### Overview
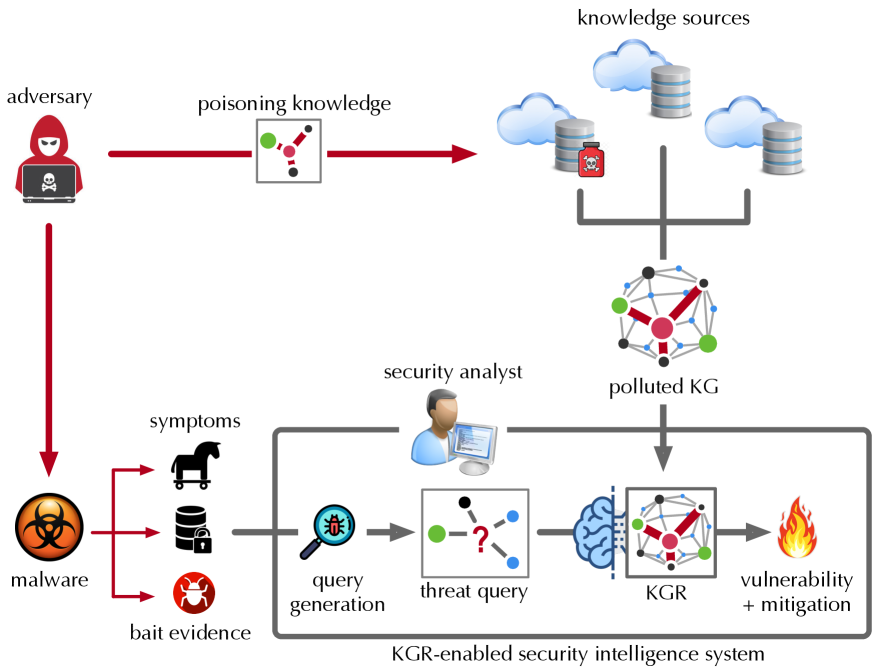
The image depicts a diagram illustrating a KGR-enabled security intelligence system and how an adversary can attempt to poison the knowledge used by the system. The diagram shows the flow of information from knowledge sources, through a security analyst, to a knowledge graph (KG), and ultimately to vulnerability detection and mitigation. It also illustrates how an adversary can inject "poisoning knowledge" into the system.
### Components/Axes
The diagram consists of several key components:
* **Adversary:** Represented by a hooded figure.
* **Knowledge Sources:** Represented by multiple cloud and cylinder icons.
* **Polluted KG:** A knowledge graph that has been compromised.
* **Security Analyst:** Represented by a person working on a computer.
* **Malware:** Represented by a biohazard symbol and a gear.
* **Bait Evidence:** Represented by a horse head and a lock with a red bug.
* **Query Generation:** Represented by a gear with a bug.
* **Threat Query:** Represented by a question mark inside a circle.
* **KGR:** Knowledge Graph Reasoning, represented by a brain-shaped icon.
* **Vulnerability + Mitigation:** Represented by a flame.
* **Arrows:** Indicate the flow of information and attacks.
Labels include: "adversary", "poisoning knowledge", "knowledge sources", "security analyst", "polluted KG", "malware", "symptoms", "bait evidence", "query generation", "threat query", "KGR", "vulnerability + mitigation", and "KGR-enabled security intelligence system".
### Detailed Analysis or Content Details
The diagram illustrates the following flow:
1. **Adversary Attack:** The adversary attempts to "poison knowledge" by injecting malicious data (represented by red dots connected by lines) into the "knowledge sources". This is indicated by a thick red arrow.
2. **Knowledge Sources to Polluted KG:** The knowledge sources feed into a "polluted KG". The KG is represented by a network of nodes and edges, with a red color scheme indicating contamination.
3. **Security Analyst Input:** The security analyst receives information from the "polluted KG".
4. **Malware & Bait Evidence:** "Malware" and "bait evidence" generate "symptoms" which are fed into the "query generation" stage. The malware is represented by a biohazard symbol and a gear. Bait evidence is represented by a horse head and a lock with a red bug.
5. **Query Generation to Threat Query:** The "query generation" stage produces a "threat query".
6. **Threat Query to KGR:** The "threat query" is processed by the "KGR" (Knowledge Graph Reasoning) component.
7. **KGR to Vulnerability & Mitigation:** The "KGR" outputs "vulnerability + mitigation" information, represented by a flame.
The diagram also shows a direct connection from the adversary to the malware, suggesting the adversary is responsible for creating or deploying the malware.
### Key Observations
* The diagram highlights the vulnerability of knowledge-based security systems to adversarial attacks.
* The "polluted KG" is a central point of failure, as it affects the entire downstream process.
* The use of visual metaphors (e.g., flame for vulnerability, biohazard for malware) effectively communicates the concepts.
* The diagram emphasizes the importance of a security analyst in the loop, but also shows how their analysis can be compromised by poisoned knowledge.
### Interpretation
The diagram demonstrates a potential attack vector against KGR-enabled security intelligence systems. The adversary aims to compromise the system by injecting false or misleading information into the knowledge sources, ultimately leading to a "polluted KG". This pollution can then affect the security analyst's judgment and the accuracy of the vulnerability detection and mitigation process. The diagram suggests that robust mechanisms for validating and sanitizing knowledge sources are crucial for maintaining the integrity of these systems. The inclusion of "bait evidence" suggests a proactive approach to detecting adversarial activity, but it is also susceptible to being compromised. The diagram is a conceptual illustration of a threat model, rather than a depiction of specific data or numerical values. It serves to highlight the potential risks and challenges associated with using knowledge graphs in security applications. The diagram is a high-level overview and does not provide details on the specific techniques used for poisoning knowledge or mitigating vulnerabilities.