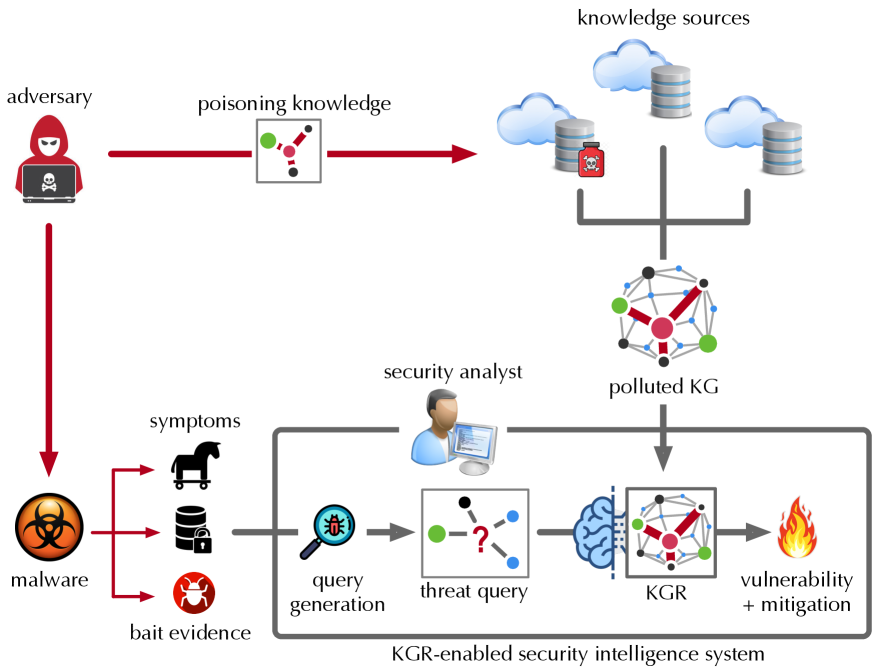
## Flowchart: KGR-Enabled Security Intelligence System
### Overview
The diagram illustrates a cybersecurity threat intelligence system where an adversary poisons knowledge graphs (KGs), leading to compromised threat detection. The system uses Knowledge Graph Reasoning (KGR) to identify vulnerabilities and mitigation strategies despite adversarial interference.
### Components/Axes
- **Nodes**:
- Adversary (red hooded figure with skull laptop)
- Malware (virus symbol)
- Symptoms (horse, locked database, bug icon)
- Bait Evidence (locked database)
- Knowledge Sources (clouds with databases)
- Poisoned KG (network graph with red/green nodes)
- KGR-Enabled Security Intelligence System (brain with network)
- Vulnerability + Mitigation (fire icon)
- **Arrows**:
- Red: Adversarial actions (poisoning knowledge)
- Gray: System processes (query generation, threat query)
- Black: Data flow between components
### Detailed Analysis
1. **Adversary Actions**:
- Poisons knowledge sources (red arrow to "poisoning knowledge")
- Introduces malware (red arrow to "malware")
- Generates symptoms (red arrow to "symptoms")
2. **Malware Symptoms**:
- Represented by three icons: horse (Trojan?), locked database (data breach), bug (code vulnerability)
- Connected to "bait evidence" (locked database icon)
3. **Knowledge Sources**:
- Three cloud/database clusters labeled "knowledge sources"
- One cluster marked with poisoned symbol (skull)
4. **System Processes**:
- **Query Generation**: Magnifying glass with bug icon → "threat query" (network with question mark)
- **KGR Processing**: Brain icon → "KGR" (network graph)
- **Output**: Fire icon labeled "vulnerability + mitigation"
5. **Polluted KG**:
- Central network graph with:
- Green nodes (clean entities)
- Red nodes (poisoned entities)
- Blue nodes (connections)
- Connected to both knowledge sources and KGR system
### Key Observations
- Adversarial poisoning directly targets knowledge sources, creating a polluted KG with mixed clean (green) and compromised (red) nodes.
- The KGR system acts as a "threat intelligence brain," processing queries to identify vulnerabilities despite poisoned data.
- Malware symptoms serve as bait evidence, potentially distracting or misleading the system.
- No explicit numerical data present; relationships are qualitative.
### Interpretation
This diagram demonstrates a defensive cybersecurity framework where:
1. Adversaries compromise knowledge integrity through poisoning
2. The system must navigate corrupted data using KGR to:
- Generate threat queries from symptoms
- Reason through polluted knowledge
- Identify vulnerabilities and mitigation strategies
3. The brain icon suggests AI/ML integration for adaptive threat analysis
4. Color coding (red/green) visually represents data integrity states
The system's effectiveness depends on its ability to distinguish poisoned from clean knowledge while maintaining detection accuracy. The flowchart emphasizes proactive threat hunting through knowledge graph analysis rather than reactive signature-based detection.